




The winds of change
“The risk of permanent capital loss is the only risk to worry about.” —Paul Johnson, Value Investor
The first half of 2026 presented investors with plenty of ways to both make and lose money. Time will tell which of these prove permanent. Extreme moves in security prices tend to reflect change, and investors’ various attempts to profit from it or sidestep its lethal effects. When uncertainty about the future is high, a chasm opens, leaving ample room for speculation and for investors’ emotions to pour in.
We are currently witnessing two historically significant shifts. The first pertains to technology and the race to build Artificial General Intelligence (AGI). The second relates to geopolitical change and the shift away from a rules-based global order, with America at its head. Both have broad implications for financial markets. The ‘rupture’ in the world order, as described by Canadian Prime Minister Mark Carney at Davos in January, is also playing out across the technological plane. At the start of June, Trump banned exports of Anthropic’s latest Large Language Models to the rest of the world. Whilst access has now been reinstated, the potential for this to recur without warning puts countries reliant on foreign technology at risk.
In this context, China’s growing self-sufficiency is impressive. The country has succeeded in developing models that are a close second to the best of the US, even as imports to China of leading-edge chips have been restricted. Moreover, these models are reported to run at a fraction of the cost. According to Stanford’s AI index, the best Chinese models were 2.7% less performant than their US counterparts in April 2026, down from a 17.5–31.6% gap in May 2023. Necessity, paired with strategic autocracy, has been the mother of invention. Whilst the models themselves have been the product of private enterprise, the conditions for their success (talent development, diffusion infrastructure and access to power) have been largely a function of public policy.
Competition in AI is just one piece of a broader, nationalistic landscape. The win-win mentality of globalisation appears firmly in the rearview mirror, and the upshot is greater self-reliance facilitated by physical investment. Localising capability means building it on your own turf, whether AI datacentre capacity or the onshoring of automotive manufacturing. Since 2018, US policy from the CHIPS Act to tariffs and to the One Big Beautiful Bill has been framed around maintaining the country’s lead against China. Infrastructure investment is the upshot. Europe recognises the need for the same strategy although it is happening at a more glacial pace. In 2024, former president of the European Central Bank, Mario Draghi, wrote a report for the European Commission entitled ‘The Future of European Competitiveness’. The conclusion was a requirement for greater physical investment to the tune of $750-800bn per annum to 2030 – which would take the EU’s investment-to-GDP ratio back to post-WW2 reconstruction levels.
Keeping it real
This is not an easy environment in which to invest. For our mandate, it requires flexibility without relinquishing the principles we have established to keep us and our investors from harm. Those principles lead us to steer clear of high levels of cyclicality and capital intensity. This is in the knowledge that certain sectors, such as base metal miners or integrated oil companies, experience high levels of operational leverage and complexity, with bottom lines ultimately geared to commodity prices that they cannot control. At the same time, we expect that many companies enabling physical investment are poised to perform well in the years to come, and we continue to widen our investment aperture, without compromising our principles.
In the portfolio we have sought to gain exposure to this area without compromising on quality. Over the past 18 months, this has entailed purchases of the likes of Canadian National (CN), the railroad company, and Hubbell, the US manufacturer of components for the electric grid, which we wrote about in Investment Report 85 last summer. These are businesses exposed to investment in infrastructure and manufacturing, but which are not at the mercy of any single extraneous factor to succeed. Both have contributed strongly to the strategy’s performance.
For Canadian National, the volume of cargo transported over its rails depends on demand for physical assets, but its exposures are broadly diversified, ranging from grain and lumber to automobiles, energy products and consumer goods. On top of standing to benefit from those aforementioned tailwinds to volumes, both Hubbell and CN command pricing power thanks to structurally advantaged competitive positions. CN is one of six major ‘Class 1’ railroads across North America which co-exist as localised monopolies. Thanks to discrete ownership of the land over which the rails run, there is usually only one railroad that can service a required route meaning CN sets prices for its customers, not the other way round. In an environment of higher oil prices, the cost advantage of transporting over rail versus truck rises – although, for many journeys, trucks are not a viable substitute anyway. These dynamics make for an inflation-resilient business model, with attractive operating margins and, we believe, the ability to compound in the low-teens over time.
Whilst we have conviction in the secular tailwinds behind businesses like CN and Hubbell, they are at the more cyclical end of our investment universe. We must therefore size them accordingly in the portfolio and be attuned to valuation. It is easy for investors to be lulled into a false sense of security about market cycles when that cycle is extended. We would note that anyone who has joined the industry in the past 17 years has not experienced a recession outside of the brief one manufactured in Covid. This has led to an extraordinary and unrepresentative period for capital markets, during which both investors and businesses have become accustomed to rapid policy support and readily available capital.
Multi-year cycles
Before the arrival of ChatGPT’s 3.5 model in November 2022, and the multi-year investment in AI capital expenditure (capex) that followed, the US economy looked on track for a recession. The fastest rate hiking cycle in four decades met with a cost-of-living crisis and a manufacturing recession; it also met with a generational shift in technology which set in motion huge levels of innovation and investment. The technology sector has been the primary driver of US earnings growth in recent years. In 2025, just seven tech companies accounted for roughly 50% of total S&P 500 earnings per share (EPS) growth, a trend persisting into 2026. In the first quarter of 2026, paper profits on investments in private AI leaders like Anthropic inflated the S&P 500’s reported quarterly earnings growth from an underlying 16% to a reported 28%.[1] Bloomberg-compiled consensus forecasts predict US market earnings to grow 17% this year and 16% next. Over the past 40 years, the S&P 500’s earnings have grown by an average of 6.7% per annum, including recessionary periods which have occurred on average every 9 years.
When questioning the sustainability of recent growth, it is important to distinguish between the earnings generated by the construction of AI infrastructure and those derived from the economic use of AI. AI usage, as measured by the revenues of the Large Language Model companies, is growing rapidly but the aforementioned ‘paper profits’ remain just that. SpaceX, Elon Musk’s satellite, space exploration and AI company, IPO’ed in June having generated just $19bn of revenue last year and with negative free cash flow of $14bn. Its market capitalisation of over $2trn on the first few days of trading put the shares on a multiple of over 100x trailing revenue – there is no precedent for an IPO of this size (it is the largest of all time) and at this valuation. Goldman Sachs forecasts SpaceX’s LLM subsidiary SpaceXAI to grow its revenues from $3bn in 2025 to $322bn in 2030. Anthropic’s CEO Dario Amodei likes to observe humans’ tendency towards linear extrapolation and the difficulty we have in wrapping our heads around exponential growth. This has certainly been true when it comes to investors underestimating Anthropic; who would have predicted that the company’s annual revenue run rate would rise from $1bn at the end of 2024 to $9bn at the end of 2025 and $47bn by May 2026. It would seem however that investors in SpaceX are now getting the memo.
Where cash flows are growing and positive today is in technology hardware – the ‘picks and shovels’. The market’s willingness to fund the AI build requires confidence that AI usage will generate an economic return. Ahead of this evidence, the market is blessed with a generous and willing funding environment. This is underlined by the fact that SpaceX’s IPO was 4x oversubscribed.[2] It can also be seen in the fact that 11 single-stock ETFs were launched on SpaceX immediately after the IPO. Retail cash equity trading volumes in May and June exceeded the previous record of January 2021, the height of the meme-stock boom. The continuation of this funding environment will be key as more companies come to market, and as the capex build becomes increasingly reliant upon debt markets for its funding.
The cost of capital
It is often only with hindsight that the catalyst for a reversal in sentiment becomes clear. There is however one obvious risk in the window today in the form of the Strait of Hormuz. We suspect that it is easier for US investors, in the throes of AI optimism and listening to a President ostensibly assured of his position, to put aside the risk of a supply-driven inflationary shock. It is however worth noting Iran’s resolve in the face of the ongoing conflict. The economic clout revealed by the nation’s control over the Strait has furnished it with a weapon more powerful than any amount of defence spend could replicate. We also note the country’s capacity and willingness to suffer for what it has termed a holy war – or in the words of Iran’s leader Mojtaba Khamenei – ‘the Third Sacred Defense’. This underlines a moral imperative behind Iran’s defence against Israel and the US, even as the US acts and speaks as if it is facing an economically motivated and rational adversary. We suspect that there will be a long and tortuous path to the Strait fully reopening.
This matters for markets because the conflict marks the largest oil supply shock in history. So far, reserve releases from China in particular have blunted the effect of a c. 10% reduction in world supply. Petroleum reserves are however finite and will ultimately need to be replenished. We are not in the business of making point predictions about geopolitics, or the oil price, but we would caution that the equity market is historically poor at pricing in the impact of such events. The 1970s illustrates this well – the consequences of the Yom Kippur War oil embargo were only felt in stock markets after a lag of several months (see Figure 1). US Consumer Price Index (CPI) was 4.2% in May 2026 and 3.5% in June 2026; it is likely to rise further if supply across a number of critical energy sources and fertiliser feedstocks remains restricted. The market is not pricing this – and we expect that the currently liberal funding of AI-related spend could be in jeopardy should inflation start to impact on the cost of capital elsewhere. Such was the experience in 2022, when rates moved higher with inflation and a spate of profitless tech companies saw their share prices fall.
FIGURE 1: S&P 500 INDEX IN 1973/74 – STOCKS TOOK A LONG TIME TO GRASP THE IMPLICATIONS OF THE OIL EMBARGO
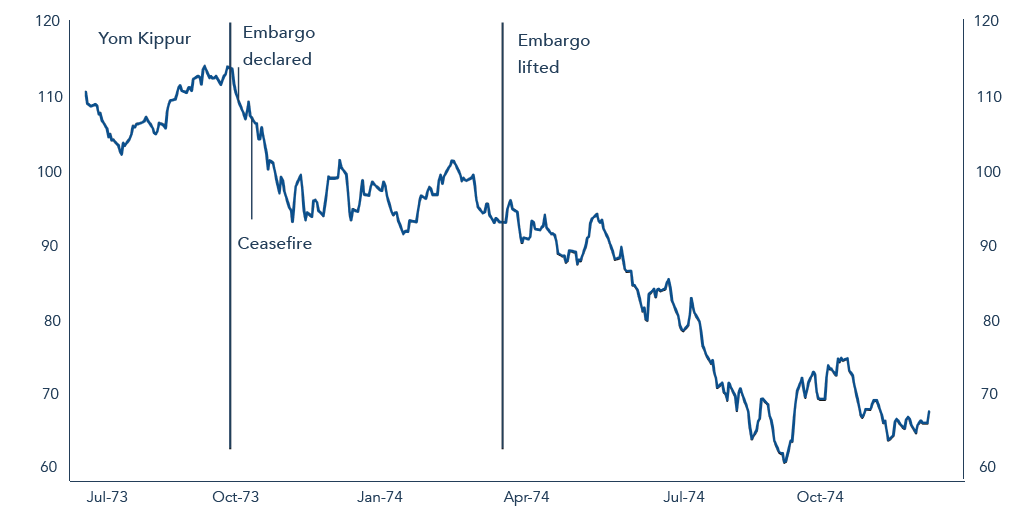
Source: Bloomberg. Yom Kippur war start date: 6 Oct 1973. Oil embargo dated 19 Oct 1973. 25 Oct 1973 ceasefire agreed. Embargo officially lifted in March 1974. Past performance is not a guide to future performance and other factors, such as inflation, could also have influenced market performance.
We therefore approach today’s markets with both openness and caution. AI may create substantial new pools of value, but it is not yet clear where all of that value will accrue, which competitive advantages it will reinforce and which it will erode. We see clear sources of potential for market sentiment to turn less sanguine. We do not position for a binary outcome; in the portfolio, Alphabet remains one of the largest holdings, and a clear bet on a positive AI future – in our view, the company has many ways to win; owning the world’s preeminent (and highly cash generative) search engine which is seeing accelerated growth, owning one of the three leading LLMs, developing its own custom silicon chips, and running one of the world’s leading cloud businesses.
Performance
Year-to-date the multi-asset portfolios are broadly flat – a disappointing result against the backdrop of a strong market. The performance of our equities has been mixed – up low single-digits, with a mix of winners and losers. We have taken advantage of substantial price moves to both add to stocks opportunistically as well as to trim those where valuations have become extended. The net result has been to reduce our equity allocation slightly – from a low-forties percentage weighting last summer (following our additions during the tariff debacle) to the high-thirties today. Although the gold price is today roughly flat compared with the start of the year, our gold exposure has contributed positively year-to-date thanks to some profit-taking at the end of January. Index-linked bonds continue to grind out a positive return whilst our c. 9% yen exposure has been a moderate detractor.
We were asked by a client recently how we will generate high single-digit returns with less than 40% invested in equities. The short answer is that we would likely struggle if this number were set in aspic. In reality, the percentage allocation to equities has moved dynamically between the low-twenties (in 2022) and the low-seventies (in 2009) over the 25 years of the strategy’s life. We generally move countercyclically to the market – leaning into risk when we are being paid to take it and taking our foot off the pedal when valuations and animal spirits are high. Figure 2 illustrates three major shifts in our equity weighting in recent years.
FIGURE 2: DYNAMIC ASSET ALLOCATION DURING MARKET DRAWDOWNS
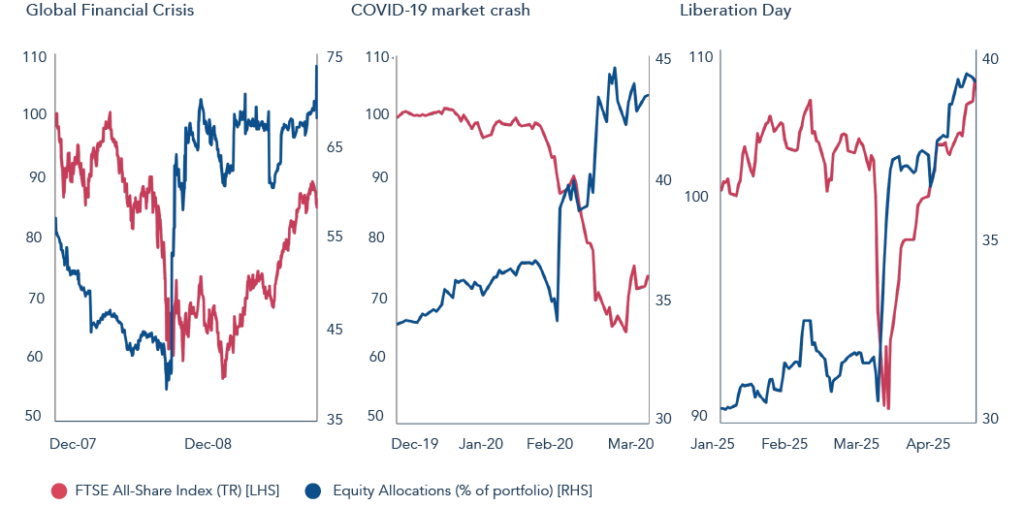
Source: Troy Asset Management Limited, 30 June 2026 . Past performance is not a guide to future performance. All references to benchmarks are for comparative purposes only. Asset allocation and holdings subject to change. The price of the FTSE has been rebased to 100. The information shown relates to a mandate which is representative of, and has been managed in accordance with, Troy Asset Management Limited’s Multi-Asset Strategy.
Our objective is to first protect and then to grow. Where we err, it will generally be on the side of caution. 87% of the S&P 500’s gains year-to-date have been driven by the semiconductor and technology hardware sectors. We expect that this trade could well continue but we would rather abstain than suffer sharp drawdowns for our clients when it turns. We are also wary of the extent to which retail and passive equity participation has driven markets. At the same time, we have roughly 10 percentage points more in equities today than we did 18 months ago. This reflects the fact that many companies, currently perceived as boring or with advantages for an AI world that are misunderstood, are trading at multi-year low valuation multiples. One such example is the credit bureau Experian, whose shares we have added to on a 15-year low price-to-earnings multiple, with the view that this is a business whose moat and data will become more valuable in an AI future.
The bond market too is already reflecting a higher cost of capital. Given our caution around inflation, we have c. 30% of the portfolio in index-linked bonds today, split evenly between the UK and the US. In recent weeks we have extended duration by just under a year, to around 2.5 years, locking in real yields that are, with the exception of a brief period in 2023, at their most attractive levels since 2007. The real yield on the 5-year Treasury Inflation-Protected Security in the US is up from around 1% in February, before the war in the Gulf broke out, to 2% today. As a reminder, this is the yield that investors can expect to receive before inflation. Inflation over the past five years has annualised 4.2%. If this repeats, the annualised return from these bonds would be >6%, with limited duration risk. The reason that, despite higher inflation, inflation protection has become cheaper is that the market does not believe inflation is here to stay. The bond market is pricing in inflation of 2.3% in the US over the next 5 years, even though CPI has been considerably higher now for several years. At the same time, bond markets are concerned that the Federal Reserve is no longer likely to lower interest rates and are pricing in rate hikes instead.
We are optimistic for the companies we hold and very much on the front foot to add to equities should valuations derate and expectations fall from their current high levels. We are also willing to move increasingly into those areas that, in an AI frenzy, may be overlooked. Just over 20% of the portfolio is in short-dated nominal bonds today – dry powder which is ready to be deployed into stocks when prices come our way.
We are delighted to announce that this month Rachel Beagles has joined Troy’s board. Rachel brings with her great depth of understanding of our industry, having served on the boards of a number of investment trusts and companies, as well as chairing the Association for Investment Companies (AIC). We very much look forward to working with Rachel and learning from her wealth of experience.
[1] AI Index Report 2026, https://hai.stanford.edu/assets/files/ai_index_report_2026.pdf
[2] Demand for shares was four times higher than the number available.
The information shown relates to a mandate which is representative of, and has been managed in accordance with, Troy Asset Management Limited’s Multi-Asset Strategy. This information is not intended as an invitation or an inducement to invest in the shares of the relevant fund.
Performance data provided is either calculated as net or gross of fees as specified in the relevant slide. Fees will have the effect of reducing performance. Past performance is not a guide to future performance. This presentation may also contain forward-looking statements that are based on current expectations,
estimates, forecasts, and projections. These statements are not guarantees of future performance and involve certain risks and uncertainties which are difficult to predict. All references to benchmarks are for comparative purposes only. Overseas investments may be affected by movements in currency exchange
rates. The value of an investment and any income from it may fall as well as rise and investors may get back less than they invested. Neither the views nor the information contained within this document constitute investment advice or an offer to invest or to provide discretionary investment management services and
should not be used as the basis of any investment decision. There is no guarantee that the strategy will achieve its objective. The investment policy and process may not be suitable for all investors. If you are in any doubt about whether investment policy and process is suitable for you, please contact a professional
adviser. References to specific securities are included for the purposes of illustration only and should not be construed as a recommendation to buy or sell these securities.
Although Troy Asset Management Limited considers the information included in this document to be reliable, no warranty is given as to its accuracy or completeness. The opinions expressed are expressed at the date of this document and, whilst the opinions stated are honestly held, they are not guarantees
and should not be relied upon and may be subject to change without notice. Third party data is provided without warranty or liability and may belong to a third party.
All references to FTSE indices or data used in this presentation is © FTSE International Limited (“FTSE”) 2026. ‘FTSE ®’ is a trade mark of the London Stock Exchange Group companies and is used by FTSE under licence. Issued by Troy Asset Management Limited, 33 Davies Street, London W1K 4BP (registered in England & Wales No. 3930846). Registered office: 33 Davies Street, London W1K 4BP. Authorised and regulated by the Financial Conduct Authority (FRN: 195764) and registered with the U.S. Securities and Exchange Commission (“SEC”) as an Investment Adviser (CRD: 319174). Registration with the SEC does not imply a certain level of skill or training. Any fund described in this document is neither available nor offered in the USA or to U.S. Persons.
© Troy Asset Management Limited 2026.