“As a rule, panics do not destroy capital; they merely reveal the extent to which it has been destroyed by its betrayal into hopelessly unproductive works”
John Mills “On Credit Cycles and the Origin of Commercial Panics” 1867
AI concentration
Recent underperformance has been painful, and we apologise to our investors. It is frustrating that when looking at the chart of our performance we were largely in touch with our peers until late 2024. Recently, however, an alligator’s jaws have opened up as our peers have made progress while we have lagged.
It is hard to overemphasise the extent to which the current Artificial Intelligence (AI) boom is dictating events. Market performance has been strongly influenced by the AI boom to which we have limited exposure. This effect has been compounded by our software holdings, which have derated owing to AI disruption fears that we think will be ultimately misplaced.
We are witnessing a classic capital expenditure cycle which is just that; a cycle. This can create a lot of activity and earnings while it is ongoing but must ultimately come to an end – albeit that the timing of this is uncertain.
AI is driving market activity in three key ways. Owing to the scale of the companies involved, it is responsible for a very large proportion of the gains that investors have recently enjoyed. Furthermore, the sheer scale of the spending (current estimates are for capex[1] of c.$850bn in 2026) means that this capital allocation decision is now itself an economic variable. Without the stimulus from the build-out of AI infrastructure, the underlying economy would be looking distinctly sub-par.
Finally, the extraordinary gains are supporting consumption via the wealth effect. For the haves, times are good and they are enjoying themselves, for the have-nots times are tough as represented by the so-called K-shaped economy.
History suggests that the scale of a boom has tended to be a reliable indicator of the scale of the bust that follows.
At such times it is important to have a sense of perspective. However all-encompassing the effects of the current AI spend may appear, we believe they are temporary. History suggests that the scale of a boom has tended to be a reliable indicator of the scale of the bust that follows. History would also suggest that when capital is deployed this quickly it is likely to be misallocated. Indeed, since all the scale players are building capacity to “win” the AI arms race, it implies that overcapacity is almost inevitable. This is potentially problematic given that, unlike say railways or fibre optics, some of the IT hardware is likely to become obsolete in a matter of years (not decades). This combination of the vast scale of the spend combined with the short shelf-life of the kit means the misallocation of capital could be extraordinary.
When capital is allocated to fixed assets on the basis of assumptions that prove false, the consequences extend well beyond markets, affecting economic activity, employment and inflation. The combination of these forces is the stuff of recessions and severe bear markets, at least for those parts of the market swept up in the preceding boom.
It is likely that the above would hold true even if the products underpinning this boom have attractive economics. We have serious doubts that this will be the case. Large language models do not have the attributes one would associate with an exceptional business model. Given users interact with the machine rather than each other, network effects are likely to be less strong than for other consumer technology companies. The models are capital intensive, requiring ever more compute as they scale, and are very unlikely to exhibit “winner-takes-all” characteristics as each model vies for supremacy. If these models become ubiquitous it is hard to see how they will enjoy pricing power.
Given this, the ultimate end state economics of this industry is likely to be much more akin to the airline industry – vital to the global economy but capital intensive and low margin – than the business models we have become used to seeing in technology companies. This economic reality will, at some stage, begin to call into question the level of spending potentially revealing that the AI capex edifice is built on sand.
Change of leadership
The real, long-term winners from this build-out will likely be those companies that work out how to use the technology in a profitable way.
If the boom is followed by a bust, a change in market leadership would also be consistent with history. The sectors that perform before and after the peak tend to be radically different.
Figure 1: Lessons from history
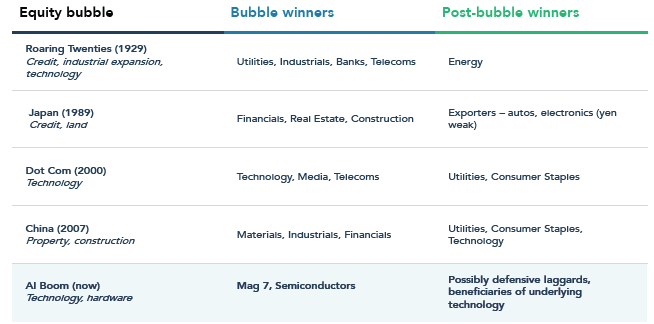
Source: Bank of America, 31 May 2026. Past performance is not a guide to future performance.
In each case, it can be seen that former market darlings falter, while overlooked companies, often with high quality and predictable earnings streams and dividends, become valued once again as the post-boom economic picture darkens. We would expect a similar dynamic this time.
Incidentally, it is worth remembering that the real, long-term winners from this build out will likely be those companies that work out how to use the technology in a profitable way. We may not know which companies these are yet and it may be some years before the structural winners become clear.
Late cycle
If one accepts the premise that at some point this cycle will end, when might that be? Our contention is that we are late cycle. We can think about this in several ways.
First simply by observing the concentration of the equity market relative to similar speculative periods.
Figure 2: The bubble history of stock market concentration, measured as a % of US market cap
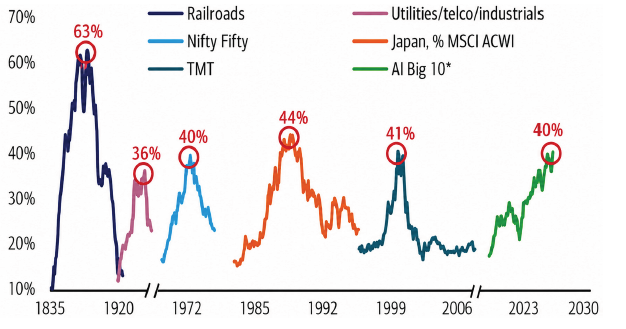
*AI Big 10= Magnificent 7 +Broadcom, AMD, Micron. TMT= Technology, Media, Telecommunications. Nifty Fifty= 50 large-cap stocks on the New York Stock Exchange in the 1960s and 1970s. Source: BofA Global Investment Strategy, GFD Finaeon, Bloomberg, 31 May 2026. Past performance is not a guide to future performance. Note: Japan is measured as % of MSCI ACWI, all others are as % of US stock market. Although an inexact science, periods of extreme concentration tend not to last.
Although an inexact science, periods of extreme concentration tend not to last.
Second, the spending involved. AI related capital expenditure now represents c.7% of US GDP (an astonishing number). The US residential property bubble pre-Global Financial Crisis (GFC) peaked also at 7%, the Japan 1980s residential bubble at 9%, the Spanish pre-GFC/Euro crisis at 8% and the Chinese construction boom in the 2010s (which was epic and from which the economy is still recovering) at 7.5%. If we are not there yet it is likely we are not far off the peak.
Finally, the upcoming mega Initial Public Offerings (IPOs) kicked off by SpaceX – which although it is much more than an AI company, it does have AI related businesses within it. This will be followed by the likes of OpenAI, Anthropic and Cohere. IPOs are conducted in what are deemed “favourable market conditions”. This means favourable for the seller but not necessarily the buyer. As such, IPOs often tend to mark the peak of whatever trend has been in place as insiders cash in by allowing others to share in their good fortune.
Examples would include Goldman Sachs floating in May 1999 at the peak of the technology/media/internet boom, US private equity behemoth Blackstone floating in June 2007, just before the Global Financial Crisis and commodities trader, Glencore, floating in May 2011 just as commodity prices peaked.
It should be remembered that the scale of the upcoming IPOs dwarfs these examples echoing our previous observations regarding the scale of the potential misallocation of capital.
There is an old market expression that “you have got to feed the ducks when they are quacking”. Never has this been truer than today. The coming months are likely to be extremely interesting.
Brave New World
It should also be remembered that while markets are transfixed by the potential for AI there is profound change taking place elsewhere. As the world ‘Balkanises’ into US and Chinese spheres of influence, we are seeing structural changes in interest rates, inflation, currencies and security. That this is happening at a time of high levels of government indebtedness and large peacetime deficits puts further strain on sovereign bond markets and constrains the ability of governments to act.
This is a very different backdrop from the one we have been used to for over 40 years. For the patient investor, it should create both threats and opportunities to different economies and businesses for years to come. This is reflected in the increased level of turnover within the portfolio.
New investments
We have established five new investments in the last six months. These were funded by the sale of Nestlé and McDonalds both of which were fully valued relative to the growth profile of those businesses, together with several reductions across the portfolio.
We initiated a new investment in IG Group at the end of 2025 and have added to the position since. The investment case rests on the premise that this is a good business that had slightly lost its way. New management are sharpening and reinvigorating the company to make a faster growing, more technology-led and retail focussed spread-betting and share trading platform. Recent results suggest these efforts are paying off with the core customer base demonstrating growth for the first time in years. The shares have performed strongly since we invested but remain good value given the improving prospects we observe.
Novo Nordisk was also added to the portfolio earlier in the year. This will be familiar to many as the company that pioneered both the management of diabetes as well as more recently weight-loss drugs. The company originally benefitted from first mover advantage in the obesity sphere but has subsequently allowed competitor Eli Lilly to steal a march. This has caused the share price to decline by nearly 80% from the peak precipitating a change of CEO. This means that a company that remains an important competitor in a growing and very profitable industry is now deeply out of favour and we believe exceptional value. Furthermore, what makes weight-loss drugs different to other pharmaceutical products is that they are likely to behave more like consumer products. Hence, as prices decline, demand is likely to increase as more people gain access to the product. This dynamic is further enhanced by the launch of a pill form, which will have a lower barrier to adoption than the injectable version. The potential for this company combined with the low valuation makes for an excellent asymmetric risk-reward profile.
A company we have followed for some time but in which we have only recently invested is CTS Eventim. This is the dominant ticketing platform and venue operator in Europe, similar to Ticketmaster in the US but with a much more attractive valuation. The shares have fallen as investors have worried about softness in consumer demand as well as threats from AI. We see the former concern as cyclical and the latter as misplaced. The company benefits from the symbiosis of controlling both ticketing and venues which creates a data advantage relative to peers as well as captive audiences. Further, we believe that in a world of increased digital atomisation the demand for real life, collective entertainment will have greater attraction. This is reflected in the consumption patterns of younger consumers who spend more on experiences relative to goods compared to previous generations.
We have long admired LVMH as a premier luxury goods company. The attractive economics of this industry reside in the deeply embedded desire for humans to show off. This instinct is monetised via brands whose heritage and durability are hard to replicate. An elevated valuation combined with weakness in the crucial Chinese consumer market has caused the shares to fall to a level that enabled us to establish an investment.
Finally, we bought shares in the largest independent publicly listed pan-Asian life and health insurance company, AIA Group. The company benefits from several structural tailwinds. Insurance coverage in Asia is still very low compared to developed markets which is likely to change owing to a fast-growing middle class, rising health costs, inadequate social safety nets and a rapidly ageing population. Further, the company is one of only two foreign-owned life insurance companies that is licenced to operate in the vast Chinese market. Over many years the company has built up a highly skilled and trusted sales network. Despite the attractions of being a top-tier financial franchise with excellent market positions and a long runway for growth the shares trade towards the bottom of their historic valuation range.
Valuation and dividend growth
While our underperformance has been disappointing it has left the portfolio representing excellent value relative to a stretched broader market.
Figure 3: Portfolio free cashflow yield relative to market
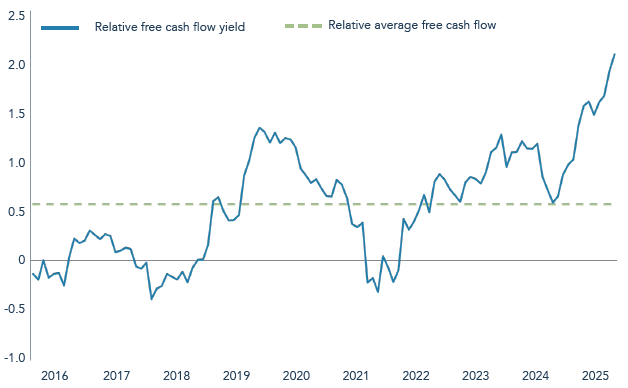
Source: FactSet, since inception 1 November 2026 to 30 April 2026. Past performance is not a guide to future performance. Relative data of Troy Global Income Strategy vs MSCI World Index. All references to benchmarks are for comparative purposes only. The information shown relates to a mandate which is representative of, and has been managed in accordance with, Troy Asset Management Limited’s Global Income Strategy.
It has also allowed us to embed accelerating income growth by taking advantage of opportunities that have presented themselves in assets that have been left behind by the current euphoria as outlined above.
Figure 4: Troy Global Income Strategy – dividend history

*Projections Source: Troy Asset Management Limited, 31 May 2026, GBP. Past performance is not a guide to future performance. Income generated (if any) may fall as well as rise. Projected dividends are illustrative only and not guaranteed. Actual income may vary and may be affected by market conditions, fund charges, and changes to dividend policy. The information shown relates to a mandate which is representative of and has been managed in accordance with Troy Asset Management Limited’s Global Income Strategy.
This combination of excellent value and accelerating income growth at a time of speculative excess should, in time, serve investors well.
[1] Capital Expenditure
The information shown relates to a mandate which is representative of, and has been managed in accordance with, Troy Asset Management Limited’s Global Income Strategy. This information is not intended as an invitation or an inducement to invest in the shares of the relevant fund. Performance data provided is either calculated as net or gross of fees as specified in the relevant slide. Fees will have the effect of reducing performance. Past performance is not a guide to future performance. All references to benchmarks are for comparative purposes only. Overseas investments may be affected by movements in currency exchange rates. The value of an investment and any income from it may fall as well as rise and investors may get back less than they invested. Neither the views nor the information contained within this document constitute investment advice or an offer to invest or to provide discretionary investment management services and should not be used as the basis of any investment decision. There is no guarantee that the strategy will achieve its objective. The investment policy and process may not be suitable for all investors. If you are in any doubt about whether investment policy and process is suitable for you, please contact a professional adviser. References to specific securities are included for the purposes of illustration only and should not be construed as a recommendation to buy or sell these securities. Although Troy Asset Management Limited considers the information included in this document to be reliable, no warranty is given as to its accuracy or completeness. The opinions expressed are expressed at the date of this document and, whilst the opinions stated are honestly held, they are not guarantees and should not be relied upon and may be subject to change without notice. Third party data is provided without warranty or liability and may belong to a third party.
Although Troy’s information providers, including without limitation, MSCI Solutions LLC and its affiliates (the “ESG Parties”), obtain information from sources they consider reliable, none of the ESG Parties warrants or guarantees the originality, accuracy and/or completeness of any data herein. None of the ESG Parties makes any express or implied warranties of any kind, and the ESG Parties hereby expressly disclaim all warranties of merchantability and fitness for a particular purpose, with respect to any data herein. None of the ESG Parties shall have any liability for any errors or omissions in connection with any data herein. Further, without limiting any of the foregoing, in no event shall any of the ESG Parties have any liability for any direct, indirect, special, punitive, consequential or any other damages (including lost profits) even if notified of the possibility of such damages. Issued by Troy Asset Management Limited, 33 Davies Street, London W1K 4BP (registered in England & Wales No. 3930846). Registered office: 33 Davies Street, London W1K 4BP. Authorised and regulated by the Financial Conduct Authority (FRN: 195764) and registered with the U.S. Securities and Exchange Commission (“SEC”) as an Investment Adviser (CRD: 319174). Registration with the SEC does not imply a certain level of skill or training. Any fund described in this document is neither available nor offered in the USA or to U.S. Persons.
© Troy Asset Management Limited 2026.