Blink and you’ll miss it
The strategy delivered returns of around 9-10% for the 2025 calendar year. Our equities performed respectably, rising +10% in local currency terms. It was a strong year for stock markets overall, with the FTSE All-Share and S&P 500 rising +24% and +18% respectively and many emerging markets indices doing better than that, aided by a weaker dollar and investors looking for opportunities outside the US.
Beneath the surface of a buoyant market, there were strongly divergent performances by company. Of particular note was the underperformance of so-called ‘quality’ equities, which experienced their worst period of underperformance versus the market since the dot-com boom. Amidst the animal spirits, there was also a technical bear market with the S&P 500 falling -20% from February to April 2025. The strategy fell just over -2% over the same time frame. US tariffs were the single greatest driver of market volatility in the year, and we took advantage of lower valuations in stocks we favour to increase our equity allocation by around 10 percentage points. We did half of this on Monday 7th April. As it turned out, that day marked a low point for equity indices as the significance of US tariffs receded quickly in investors’ minds.
Gold had another strong year in 2025, returning +65% in dollars or +53% in sterling. The drivers of demand broadened out from predominantly central bank buying in 2024, to encompass increased levels of purchase activity from professional and retail investors. That said, ETF purchases remain below their Covid peak, and we believe that the drivers of central bank demand have been, if anything, strengthened by the events of the past 12 months. Data suggests that, towards the end of last year, central banks held 24% of their reserves in gold versus 23% in US Treasuries. This is the first time that gold’s share has exceeded US Treasuries since 1996. Our analysis suggests that purchasing intent by central banks remains robust, and this is reflected in the actions of countries like Brazil which increased its gold holding by 24% across the months of September and October. We have maintained our holding in gold at c.12% throughout the year.
Privilege lost?
Sustained demand for gold, despite higher prices, is less surprising when one considers the damage being wrought on the alternative. Diversification away from the incumbent reserve currency began over a quarter of a century ago when US dollars peaked as a share of global foreign exchange reserves in 1999. This trend of de-dollarisation has accelerated over the past four years and we expect it to continue as the world shifts its centre of gravity away from the United States. As we enter a new year, there is little sign of improving self-awareness within the administration. Trump’s deputy chief of staff, Stephen Miller, confirmed on national television in January: “We’re a superpower. And under President Trump, we are going to conduct ourselves as a superpower.” Recent actions, whether intervention in Venezuela or attempted control of Greenland, which are considered by the administration as cementing its superpower status, are the actions most at risk of alienating the United States from the rest of the world.
This shortsightedness is perhaps unsurprising when one considers how benign the feedback loop has been to date. 2025 saw the dollar depreciate over -9% against a basket of its important trading partners, its worst year since 2017 (coincidentally year one of Trump’s first term in office). Whilst market-savvy Treasury Secretary Scott Bessent states that the country continues to pursue a ‘strong-dollar policy’, the currency’s weakness is arguably a gift to the mission of reducing its trade deficit. We reduced our net dollar exposure from 25% to 8% in the weeks following Liberation Day on April 2nd.
Unlike the currency, the US bond market remains unperturbed. The yield on the 10-year US Treasury is currently around 4.2%, 0.3 percentage points below its level this time a year ago. Although market commentators will claim otherwise, it is seldom possible to identify what drives prices in the moment and the $27trn US Treasury market is no exception. Analysis of sovereign debt will point to interest rates, growth and inflation expectations as drivers of yields. And then there is the ‘term premium’, a catch-all for everything else. This is generally viewed as the extra yield commanded by longer-dated bonds, as compensation for the additional risk involved in lending longer-term. It can fluctuate depending on levels of uncertainty about future interest rates, or the probability of default.
In the case of the US, the term premium may also rise in the future if America’s ‘exorbitant privilege’ is eroded. Its privilège exorbitant, a term coined by France’s finance minister Valery Giscard d’Estaing in 1965, refers to the advantages enjoyed by the US thanks to its reserve currency status. Foremost of these advantages is the impact on the country’s funding costs, thanks to international demand for its bonds. Around 30% of US Treasuries today are owned by foreigners. The demand is underpinned by the centrality of the dollar in the global financial system. If the dollar’s reserve currency status is in question, so too should be its cost of borrowing. Reduced demand for US Treasuries is also the logical outcome of a world in which the United States succeeds in reducing its current account deficit with the rest of the world. We reduced US TIPS in favour of UK Linkers in 2025 and reduced duration materially.
By the end of the year, we had also built a 10% holding in short-dated Japanese government bonds. We believe that the yen should continue to behave inversely to equity markets thanks to the large carry trade that exists in the currency. It is also at a multi-year low valuation relative to both the dollar and sterling. This weakness is exacerbating the country’s cost of living crisis on account of the proportion of both food and energy that the country imports. We expect this means that there is only so much more weakness in the yen that the Japanese authorities will be prepared to tolerate.
A bubble of unknown proportions
We wrote last January about the importance of AI, both in driving stock market performance and in driving US economic growth. This importance has only grown in the past 12 months. The continued share price appreciation of a handful of technology companies has led to a further increase in market concentration. The top 10% of US stocks now account for 78% of total market capitalisation, a record high and relative to 75% in 1932 and 73% in 2000 (see Figure 1). We are often asked whether this is a bubble and, if so, when it will burst. We continue to believe that much caution is warranted but we remain open minded given how little is known at this stage. The success and monetisation of AI will ultimately depend on enterprise deployment. And we suspect that the ease with which consumers have been able to seamlessly integrate Google’s Gemini or OpenAI’s ChatGPT into their lives provides a high bar of comparison for commercial integration. Weekly active users of ChatGPT have increased from c.300m a year ago to over 800m today. This number for Gemini was not reported a year ago but has grown from likely a much smaller base to c.700m now.
Figure 1: Top 10% of US stocks as % of total US market cap
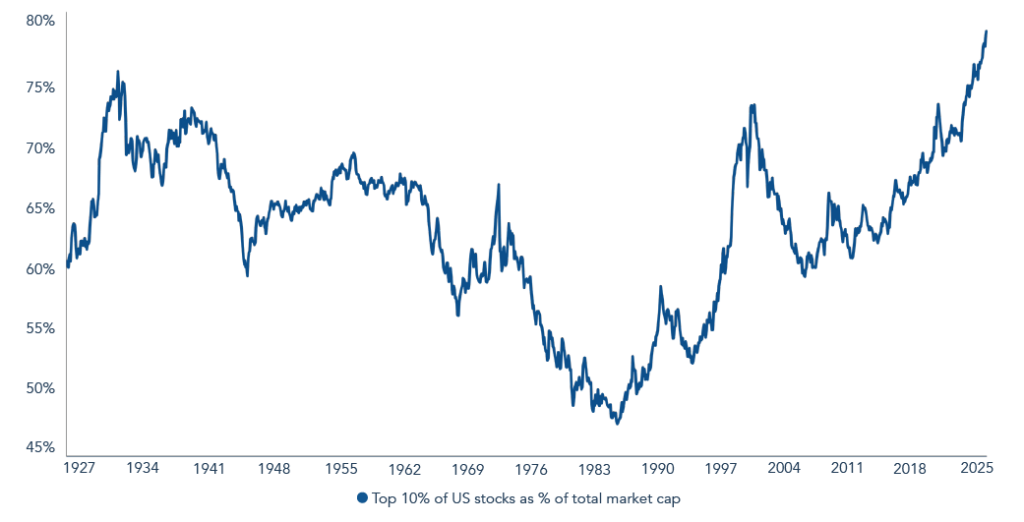
Source: Kenneth R. French Data Library; Center for Research in Security Prices (CRSP), Jefferies, 31 December 2025. Estimates based on CRSP database for total US stock market.
During the quarter, we attended an AI and technology conference in Arizona. There were companies there such as Visa, which we own, as well as many we do not, and which would not likely be appropriate for this mandate. It is our belief however that an understanding of markets and the macroeconomic outlook is vastly improved by meeting with businesses at the heart of change. Several that we met, involved in the datacentre buildout, confirmed two things: 1) that supply constraints are curtailing the rate at which infrastructure is currently being built and 2) that as soon as compute capacity is coming online, it is being used. This is different from the peak of the dot-com bubble, when ‘dark’ fibre cables were being laid down, i.e. being installed ahead of any need for their utilisation. Today, labour, power and land are all in short supply. The existence of these bottlenecks is important, because it suggests that there are some limiting, and potentially calibrating, factors when it comes to how fast the AI infrastructure build is happening.
When it comes to the demand side of the equation, it is worth reiterating the primary use cases of AI-related compute. These can broadly be broken down into training and inference. Training refers to the process of improving the models – adjusting their parameters by training them on data and using feedback to make their outputs more accurate. Inference is the process of actually using AI, i.e. someone running a query on Gemini or ChatGPT. Continued demand for training assumes that the models continue to get better, i.e. so-called ‘scaling laws’ continue to hold. This seems to be happening today, but no one knows when a ceiling might be reached. Demand for inference relies upon AI being used more widely in the future than today. That does not seem like a heroic assumption, particularly given how few businesses are currently harnessing the technology at scale. In a report from November, Deloitte estimates that inference accounted for around half of all AI compute in 2025, and that this will jump to two thirds in 2026.
The problem however lies in the economics. For the hundreds of billions of dollars currently being spent per annum, there is so far little revenue let alone profit to show for the investment. Most Gemini and ChatGPT users currently pay nothing for the service. Whether this changes will likely depend on deployment by businesses. The use cases are palpable from customer services to accounting, but the pattern of implementation is likely to be lumpy. It is easy to see why the technology sector, and coding in particular, has been an early adopter. It is also easy to imagine that the legal sector, or the back-office function of a regional bank, may experience more barriers (both practical and psychological) when it comes to implementing the technology.
Meanwhile, valuations are elevated, with the most extreme corners of excess to be found in private markets. The latest proposed funding round for OpenAI reportedly values the company at $830bn. This implied value is comparable to that of JP Morgan, the world’s 14th largest listed company, and is in the context of an annualised revenue run-rate of around $20bn. Of all the areas of excess, we believe that private markets represent the greatest point of fragility. Our colleague Fergus McCorkell has written a paper exploring the risks within private credit specifically. He speaks to the interconnectedness of public markets with private, with AI at the intersection of many of today’s fragilities. OpenAI’s fortunes are tied to a handful of the largest listed companies; a broader questioning of its business model would have widespread ramifications for asset prices.
Poised
At just over 40% in equities, we remain defensive. Where we have added in the past year, it is to stocks that either sit outside the current AI narrative or those whose business models, we believe, will succeed regardless of the endgame. Valuation continues to guide every decision. There is a material risk this year that economic growth is robust but that the cost of capital, as determined by the bond market, rises. This would have significant implications for equity markets. In addition to our aforementioned concerns regarding the US Treasury market, we also are mindful that inflation continues to be above target in both the US and the UK, even as both central banks ease monetary policy. This looks like a relinquishing of their inflation targets – which makes us more convinced that inflation will be structurally embedded and facilitated by policymakers. The ongoing undermining of US central bank independence does little to assuage these fears. Such an easy trajectory for monetary policy runs the risk of becoming unsustainable should bond markets start to worry about inflation. We suspect that any hint of higher rates would be negatively received.
We retain just under a third of the portfolio in index-linked bonds, both UK and US, having added to the former this year. Duration is deliberately short at just under two years, reflective of the risk that fiscal and, for the US, geopolitical risks come home to roost. This, combined with the portfolio’s c.20% in liquidity puts us in a strong position to take advantage of volatility when it returns.
The information shown relates to a mandate which is representative of, and has been managed in accordance with, Troy Asset Management Limited’s Multi-asset Strategy. This information is not intended as an invitation or an inducement to invest in the shares of the relevant fund.
Performance data provided is either calculated as net or gross of fees as specified in the relevant slide. Fees will have the effect of reducing performance. Past performance is not a guide to future performance. This presentation may also contain forward-looking statements that are based on current expectations, estimates, forecasts, and projections. These statements are not guarantees of future performance and involve certain risks and uncertainties which are difficult to predict. All references to benchmarks are for comparative purposes only. Overseas investments may be affected by movements in currency exchange rates. The value of an investment and any income from it may fall as well as rise and investors may get back less than they invested. Neither the views nor the information contained within this document constitute investment advice or an offer to invest or to provide discretionary investment management services and should not be used as the basis of any investment decision. There is no guarantee that the strategy will achieve its objective. The investment policy and process may not be suitable for all investors. If you are in any doubt about whether investment policy and process is suitable for you, please contact a professional adviser. References to specific securities are included for the purposes of illustration only and should not be construed as a recommendation to buy or sell these securities.
Although Troy Asset Management Limited considers the information included in this document to be reliable, no warranty is given as to its accuracy or completeness. The opinions expressed are expressed at the date of this document and, whilst the opinions stated are honestly held, they are not guarantees and should not be relied upon and may be subject to change without notice. Third party data is provided without warranty or liability and may belong to a third party.
All references to FTSE indices or data used in this presentation is © FTSE International Limited (“FTSE”) 2024. ‘FTSE ®’ is a trade mark of the London Stock Exchange Group companies and is used by FTSE under licence.
Issued by Troy Asset Management Limited, 33 Davies Street, London W1K 4BP (registered in England & Wales No. 3930846). Registered office: 33 Davies Street, London W1K 4BP. Authorised and regulated by the Financial Conduct Authority (FRN: 195764) and registered with the U.S. Securities and Exchange Commission (“”SEC””) as an Investment Adviser (CRD: 319174). Registration with the SEC does not imply a certain level of skill or training. Any fund described in this document is neither available nor offered in the USA or to U.S. Persons.
© Troy Asset Management Limited 2026.