Trust at Scale: Sovereign Debt Investments
William Gladstone once remarked that “budgets are not merely affairs of arithmetic, but go to the root of prosperity and the strength of kingdoms.” Two centuries later, the same principle holds. Behind every sovereign bond lies more than fiscal metrics and macroeconomic indicators; they are also a test of credibility, trust, and leadership.
Troy’s Investment Team shares a single philosophy for equity investing. As a team of thirteen, we debate existing holdings and new ideas together, spending significant time evaluating management teams and building confidence in their leadership. Does the CEO have clear strategic direction? Does the CFO allocate capital well? Will the board make tough decisions when needed? Countries, much like companies, are steered by people whose decisions today shape their long-term prosperity.
Within Troy’s Multi-Asset Strategy, we hold 44% across U.S., UK and Japanese sovereign debt, making government leadership and institutional strength critical factors in our asset allocation decisions. Previous reports have examined how we assess portfolio companies on issues from executive pay to natural capital use, and how our Responsible Investment framework applies to gold holdings. This quarter, we outline our approach to sovereign debt investing and highlight the key environmental, social, and governance issues that shape our analysis.
Energy Security: Fuel for Growth
Energy is the foundation of economic activity. A reliable and affordable supply supports GDP growth, while an over-reliance on imports exposes economies to geopolitical risks, price shocks, and higher subsidy costs. For this reason, we view energy security as an important element of our sovereign debt analysis.
The United States illustrates the advantages of energy abundance. Since becoming a net energy exporter in 2019, its domestic oil and gas production has helped shield the economy from global supply shocks. This was demonstrated in 2022 when the U.S. avoided the supply crunch that hit Europe following Russia’s invasion of Ukraine. Instead, the country benefited from rising Liquified Natural Gas (LNG) exports and has since become the world’s largest LNG exporter.
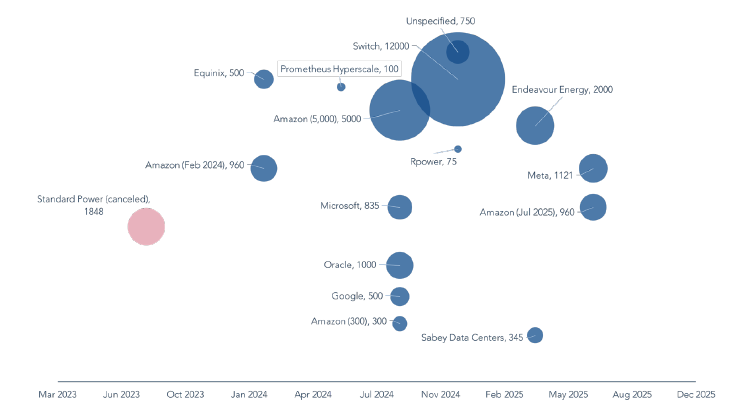
That same energy base is now critical to the build-out of power-hungry industries such as artificial intelligence (AI), where training and running models depend on electricity-intensive data centres. The surge in AI investment has already boosted economic activity, with AI-related capital expenditure estimated to have contributed around 1% to U.S. GDP growth in the first half of the year. Irrespective of one’s views on today’s excitement around AI, it is worth noting that this build-out is much easier because the U.S. can rely on its own abundant energy reserves rather than foreign supply.
While the Trump administration has strengthened energy independence through expanded fossil fuel extraction, epitomised by the “drill baby drill” approach to the Permian Basin and other domestic reserves, this has also coincided with the U.S. withdrawal from international climate commitments like the Paris Agreement. While these decisions are likely to bolster near-term energy security, they may also amplify physical climate risks that have the potential to reshape the U.S. government’s balance sheet in the long term.
Climate Resilience and Sovereign Credit
Extreme weather events like floods, wildfires, and hurricanes, can disrupt economic activity, damage infrastructure, and drive higher public spending. The fiscal costs are often immediate through disaster relief and reconstruction, and can also be enduring through higher insurance premiums, stranded assets, and weaker economic productivity.
In 2024, the U.S. experienced 27 separate weather and climate disasters, each causing losses of over $1 billion.[1] The UK is committing £7.9 billion to flood defences over the next decade,[2] while in Japan, recurring typhoons continue to test infrastructure resilience. For bond investors, especially in longer-dated debt, these examples highlight why assessing physical climate risk is central to judging sovereign creditworthiness. We use a range of sources to assess how sovereign issuers adapt to physical climate risks, combining government disclosures with third-party data. This analysis is updated annually, but it is not an exact science, it requires careful judgement to weigh government commitments against real-world measures. The impact of climate risk unfolds over decades rather than quarters, yet it is precisely this long horizon that makes it essential to monitor continuously.
Demographics
Across the developed world, falling birth rates and ageing populations are reshaping economies and straining public finances. Shrinking workforces mean slower tax revenue growth, while rising retiree populations drive up spending on pensions, health care, and social support. The challenge is evident in both the U.S. and UK, where birth rates have fallen well below the replacement rate to around 1.6 in the U.S. and 1.5 in the UK.[3]
Immigration can offset some of these pressures by adding younger, productive workers. Yet here too politics matters. Immigration policy has become tighter as governments try to strike the right balance. In the U.S., despite the advantage of a younger population compared to Europe and Japan, recent debates have centred on restrictions to skilled-worker programmes such as H-1B visas. This highlights the complexity governments face in addressing demographic pressures.
As Jerome Powell noted at the 2025 Jackson Hole Symposium, “While the labour market appears to be in balance, it is a curious kind of balance that results from a marked slowing in both the supply of and demand for workers.” The root causes of slower labour supply in the U.S. lies in declining immigration and lower labour force participation. For investors, the implications are clear. Weaker labour supply may keep unemployment steady for now, but over time it leads to slower growth, lower revenues, higher entitlement costs, and increased borrowing. Advances in AI may soften some of these labour pressures through productivity gains, but whether this is enough to counterbalance ageing populations remains uncertain.
In Governments We Trust
If demographics test fiscal capacity, governance is the true condition precedent: the entire bond market rests on trust in a government’s willingness and ability to repay. When that trust falters, default risk rises and borrowing costs climb.
The UK’s gilt crisis in 2022 made this clear. Liz Truss’s unfunded ‘mini-budget’ sparked a collapse in market confidence, sending gilt yields sharply higher and forcing emergency intervention by the Bank of England. More recently in the U.S., President Trump’s attempt to remove Federal Reserve Governor Lisa Cook was read as a challenge to central bank independence, unsettling Treasury markets and nudging yields higher, reminding investors how political pressure can quickly erode institutional trust.
Trust in the U.S. has markedly shifted and these shifts suggest its reserve currency status is gradually declining. China’s holdings of U.S. Treasuries peaked in 2013, the same year its central bank signalled it was no longer in the country’s interest to keep accumulating dollar reserves. The freezing of $300bn of Russia’s FX reserves in 2022 heightened concerns over the weaponisation of the dollar. Central banks have responded by diversifying their reserves, with surveys showing a strong tilt toward gold and away from dollars. The dollar still dominates, comprising 58% of reserves, but this is down from 65% a decade ago, and gold has now overtaken the euro as the world’s second-largest reserve asset. These are trends we cannot ignore.
Public debt levels across developed markets have also reached historic highs. The U.S. carries debt of around 120% of GDP, the UK close to 100%, and Japan more than 230%.[4] Large and persistent deficits are causing rising interest costs and an increased risk that markets demand higher yields as compensation for worsening government finances. The sustainability of these debt levels raises questions for bondholders, with long-duration debt most exposed if markets demand higher yields.
Proceed with Caution
In our recent insight paper, we outlined how Troy’s Multi-Asset Team puts dynamic asset allocation into practice. Since April, we have reduced U.S. dollar exposure from around 25% to just under 10%, mindful of political risks and the dollar’s weakening reserve-currency status. At the same time, we have added Japanese government bonds, reflecting, in our opinion, the yen’s safe-haven qualities, while maintaining a strategic allocation to gold, which stands at 11% of the portfolio. We are also actively managing the duration of our U.S. Treasury Inflation Protected Securities exposure (comprising 16% of the strategy) which currently sits at ~2 years, a reduction from ~5 years this time last year. We have taken advantage of comparatively higher expectations for nominal rates in the UK to build our exposure to UK index-linked bonds over the past quarter. The average duration of this is similarly short, at ~2 years.
Our aim is simple: to protect and grow our investors’ capital in real terms. All the analysis we undertake, be it on companies, gold, or sovereign bonds, serves that purpose. Responsible investment is not a separate exercise but forms part of our investment discipline. It also reinforces why, for bond investors, the factors that matter over the long term are more than arithmetic.
[1] NOAA National Centers for Environmental Information (NCEI) U.S. Billion-Dollar Weather and Climate Disasters (2025).
[3] World Bank
[4] IMF
Further information relating to how ESG integration is applied to the fund can be found in the fund prospectus and investor disclosure document. For further information relating to Troy’s approach to company voting and engagement, please see Troy’s Responsible Investment and Stewardship Policy available at www.taml.co.uk.
Please refer to Troy’s Glossary of Investment terms here. The document has been provided for information purposes only. Neither the views nor the information contained within this document constitute investment advice or an offer to invest or to provide discretionary investment management services and should not be used as the basis of any investment decision. The document does not have regard to the investment objectives, financial situation or particular needs of any particular person. Although Troy Asset Management Limited considers the information included in this document to be reliable, no warranty is given as to its accuracy or completeness. The views expressed reflect the views of Troy Asset Management Limited at the date of this document; however, the views are not guarantees, should not be relied upon and may be subject to change without notice. No warranty is given as to the accuracy or completeness of the information included or provided by a third party in this document. Third party data may belong to a third party.
Past performance is not a guide to future performance. All references to benchmarks are for comparative purposes only. Overseas investments may be affected by movements in currency exchange rates. The value of an investment and any income from it may fall as well as rise and investors may get back less than they invested. The investment policy and process of the may not be suitable for all investors. Tax legislation and the levels of relief from taxation can
change at any time. References to specific securities are included for the purposes of illustration only and should not be construed as a recommendation to buy or sell these securities. Although Troy’s information providers, including without limitation, MSCI ESG Research LLC and its affiliates (the “ESG Parties”), obtain information from sources they consider reliable, none of the ESG Parties warrants or guarantees the originality, accuracy and/or completeness of any data herein. None of the ESG Parties makes any express or implied warranties of any kind, and the ESG Parties hereby expressly disclaim all warranties of merchantability and fitness for a particular purpose, with respect to any data herein. None of the ESG Parties shall have any liability for any errors or omissions in connection with any data herein. Further, without limiting any of the foregoing, in no event shall any of the ESG Parties have any liability for any direct, indirect, special, punitive, consequential or any other damages (including lost profits) even if notified of the possibility of such damages. All reference to FTSE indices or data used in this presentation is © FTSE International Limited (“FTSE”) 2025. ‘FTSE ®’ is a trademark of the London Stock Exchange Group companies and is used by FTSE under licence.
Issued by Troy Asset Management Limited (registered in England & Wales No. 3930846). Registered office: 33 Davies Street, London W1K 4BP. Authorised and regulated by the Financial Conduct Authority (FRN: 195764) and registered with the U.S. Securities and Exchange Commission (“SEC”) as an Investment Adviser (CRD: 319174). Registration with the SEC does not imply a certain level of skill or training.
© Troy Asset Management Limited 2025