25 Years – Echoes
“I would rather lose half of our clients than half of our clients’ money.”
Jean-Marie Eveillard
9th October 2025 marked 25 years since the establishment of Troy. It has been quite a journey, beginning in the shadow of the dotcom boom and the ensuing equity bear market from 2001-2003. Remarkably, a quarter of a century on, markets appear once again suspended between promise and speculation. The parallels with 2000 are not perfect, but the echoes are unmistakable.
At that time, as is the case today, there was a bias to invest based on size, not on value. This has worked well in recent years as the growth in passive investment bears witness. But are investors fully aware of the risks embedded in index funds? Do they provide prudent diversification or are they merely buying what has done well? Today, the largest 10 stocks in the S&P 500 account for over 40% of the index – a higher concentration than at any point in well over a century, eclipsing the >25% peak in the year 2000, and even the c.38% reached in 1900 at the height of the railroad era. Investors may believe index funds offer diversification, but when leadership is so narrow and correlated, that assumption deserves re-examination. Investor behaviour, especially in the United States, has also taken on a more speculative feel. The options market is booming and retail participation has returned to 2021 levels. According to Bank of America, retail client portfolios exhibit 1.7x the volatility of the S&P 500, with over-concentration in thematic ETFs[1], and a tendency to chase past performance. This makes the market highly vulnerable to deleveraging. Are they unknowingly ‘All In’?
Going ‘All In’ on AI
Three years after ChatGPT launched an AI investment frenzy, the gap between technological promise and financial reality remains wide. Productivity growth has yet to reflect the transformative potential investors appear to be pricing in. Hitherto, the winners remain the beneficiaries of spending on infrastructure – the ‘picks and shovels’ of the new El Dorado. Monetisation of the internet took a decade or more. The monetisation of AI is already here, but perhaps not at the scale that some share prices are currently discounting. Many point to the exponential growth in adoption of large language models such as OpenAI’s ChatGPT and Google’s Gemini, but this is supported by eye-watering levels of capital expenditure on AI-related investment ($90bn last quarter and rising). The defence is that such unprecedented spending will pay off as it did, eventually, for the internet bubble. But the analogy holds only in part. Fibre-optic cables installed in the late 1990s still underpin global connectivity today. Much of today’s AI investment is spent on semiconductors with short useful lives and rapid obsolescence – assets that must be continually replaced and depreciated accordingly.
At this stage, the disruptive consequences of AI are less clear and capitalism’s process to select its beneficiaries will surely evolve. Yet the stock market is quick and generous to award prizes, often for those prepared to invest the most. Recent one-day share price moves in large companies – Oracle (+36%) and Advanced Micro Devices (+24%)[2] – are very reminiscent of dotcom excess. I recall in the late ‘90s finding it perverse when companies bragged about their high levels of investment. ‘Cash burn’ was a corporate badge of pride and share prices reacted positively to audacious spending intentions. This Pavlovian response may be short lived. If the stock market truly is ultimately a weighing machine and not a voting machine, then the evidence of returns will inevitably be required. The amount of spending will no doubt bring fierce competition to newly christened ‘winners’, and the capital stock being created will demand truly vast revenues and profits to earn a respectable return on investment.
Investment booms, whether dotcom or AI, for all their differences have a few characteristics in common. These are investments on a massive scale. The sellers of the capital equipment generate revenues and profits while the buyers hope to make money. The share prices of both go up on that hope. If the capital investment continues, the boom can continue. Debt markets or equity markets can call a halt at any time. Or one of the major buyers can spark a reversal of the capital cycle with just slightly lower incremental investment. Investor and corporate behaviour suggest we are closer to the cycle’s peak than its start but, in truth, nobody knows when or how it will turn.
Where there is a boom, there is a bust
We know history never repeats itself but there are plenty of rhymes to give warnings. In particular, we find them in the recent announcements of vendor financing and the financial opacity that brings. A number of companies have announced circular deals whereby one company invests in a customer to keep their revenue ticking over. NVIDIA’s recent $100bn investment in OpenAI is only one such example. This modus operandi has a ring of familiarity with IT infrastructure of the late 1990s when the likes of Nortel and Lucent extended loans to their customers.
We would certainly not suggest that AI investment will fail to have a positive long-term impact on economic growth. Meaningful and sustained improvements in productivity do seem viable, something much needed in sclerotic Western economies. But it is possible to believe two conflicting things at the same time; AI may be ‘the future’ in the way the internet was 25 years ago, but markets may still be over-extrapolating growth in the short term.
This view is corroborated by the extraordinarily detailed book Engines That Move Markets by Alasdair Nairn, which offers some sage investment lessons across the major technological shifts of history, from canals to cars to the internet. Recurring patterns include: (i) such shifts consistently follow an initial boom phase followed by consolidation, (ii) being the first mover does not guarantee success, and (iii) it is often easier to pick the losers than the winners. Perhaps unsurprisingly, successful investment through these periods was best anchored on the fundamentals – cash flow and balance sheet strength – and valuation.
One comfort of the AI boom is the financial health of some key players. While the scale of capital expenditure is staggering, it is funded by robust operating cash flows; the “Big 4” listed tech firms (Microsoft, Alphabet, Amazon, and Meta) are collectively expected to generate >$200bn in cash flow after capital expenditure in 2025. And they all have balance sheets in rude health. We also note that the headline valuations of this cohort look more reasonable (on a price-to-earnings basis) than some of the ‘internet leaders’ of 2000.
However, market-wide valuations today are testing historic boundaries. The Shiller cyclically adjusted price-to-earnings (CAPE) ratio hovers near 40x, the highest level since November 2000. With data back to 1871 – over 1,800 monthly observations – only 24 months have seen higher readings; from December 1998 to November 2000. It was certainly a metric that made us circumspect, and more risk averse, a quarter of a century ago.
We have reduced the portfolio holdings in Microsoft and Alphabet in recent months after strong runs this year. They remain exceptional businesses – maintaining robust growth at huge scale from dominant franchises across cloud, search, and productivity software. But as others ‘lean in’ we naturally ‘lean out’, nervous of the growing risks of capital misallocation as valuations rise. Microsoft and Alphabet’s ongoing capital spend suppresses free cash flow, making cash-based valuations look materially higher than those based on earnings alone.
Opportunity in divergence
Year-to-date, two of the best-performing cohorts of stocks in the US fall under the categories of ‘Nasdaq-listed with no revenues’ and ‘unprofitable small/mid caps’. Meanwhile, traditionally more defensive sectors, many of which contain high-quality, large-cap companies, have not looked more friendless since 2000 (See Figure 1). With the action elsewhere, and more conservative investing habits shunned by the fear of missing out, there are an increasing number of opportunities in the types of companies we favour. Somewhat paradoxically, our equity allocation has risen this year as a valuation divergence has emerged. This may continue while there appears little reason to hold on to stocks with consistent, if somewhat dull, profit growth. But consumer staples and healthcare stocks are unlikely to be supplanted by AI. Such companies often look dullest near the top of strong bull runs. When a reappraisal comes, they are likely to defend and perform well. It has been an active year for new equity additions to the multi-asset portfolios, and we anticipate any final, AI-led melt up in US stocks to provide us with some wonderful contrarian investment opportunities.
FIGURE 1: MARKET CAP WEIGHTINGS (SUPER SECTORS):USA
The US Stock Market has become heavily skewed to technology stocks and much less exposed to defensive sectors. This makes the index more risky and less diversified if viewed as a portfolio.
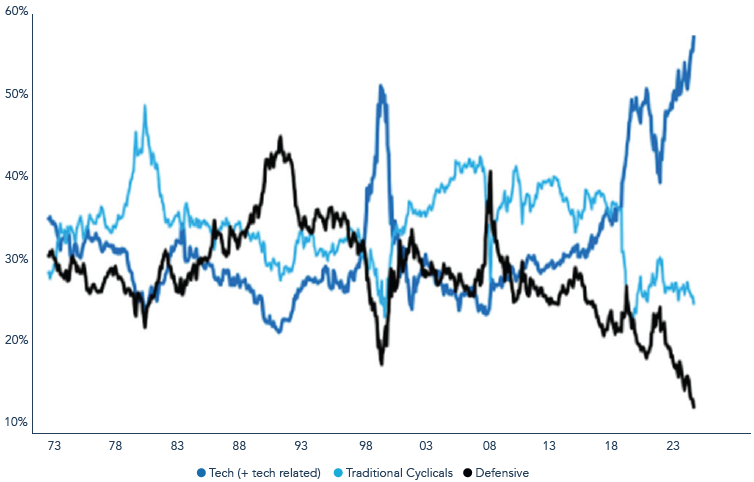
Source: Topdown Charts, LSEG, 30 September 2025.
Durable debasement
Gold has continued its bull market into 2025, rising c.50% in US dollar terms and c.40% in sterling. We accept that there are some short-term risks to the price after such a strong run. We have, sometimes against our better judgement, trimmed the holding at $3,300oz and more recently at $4,000oz. The immediate threats to the price include an unexpected rally in the US dollar or a sell-off in wider markets which may see a dash for liquidity. One such instance was in March 2020 when, in a rush for liquidity during the pandemic, gold fell 15% as financial conditions deteriorated. Bullion recovered quickly as central banks turned the liquidity taps back on. History is consistent: across the last six S&P 500 drawdowns of 15% or more, gold typically fell alongside equities at first, but by the trough had outperformed by roughly 40% on average, with positive absolute returns in four of the six episodes[3]. The diversification benefits of gold are real, but they can require a little patience.
For us, holding gold is not a short-term trade, nor is it a speculation. Bullion has been held uninterrupted for two decades in our portfolios and remains a cornerstone of the multi-asset mandate. In fact, from our first commitment in early 2005 the dollar price has risen almost tenfold (and thirteenfold in sterling terms). Over the period it has been a helpful diversifier and essential portfolio insurance of real substance and permanence, which bond markets cannot give us. Bonds have become certificates of confiscation once more, when G7 government supply is open-ended, and inflation remains sticky. The debts are unsustainable. Central banks are now cutting interest rates when inflation (as measured by the Consumer Price Indices) is well above target. Real returns from government bonds are likely to be poor in the future, which explains our preference for index-linked and short-duration issues. We recognise that rising real rates and a firm dollar – as in 2022 – can cap gold’s returns; however, even then, gold still buffered portfolios, significantly outperforming US equities during that pullback.
Gold’s repricing in the past two years has been predicated on central bank buying and only very recently on heightened institutional and retail investor interest. The gold price has risen amid a heady cocktail of supportive factors, which have coalesced to drive demand up. Or to put it another way, the value of paper money, compared to the constant that is gold, has fallen. This path of monetary dilution was set out over decades and not weeks or months.
We think several structural forces continue to underpin gold, most notably:
- persistent central bank accumulation and a gradual diversification away from the dollar
- fiscal dominance – rising debt supply and deteriorating government finances
- geopolitics, de-globalisation, and tariff risks
These sit alongside a current backdrop of stickier inflation and questions around central bank independence.
Nevertheless, the recent sharp increase of gold’s value, as expressed in the diminished value of paper money, prompted us to continue to trim the holding into the cry of ever-rising target prices. A correction after a >50% rise this year would be healthy, but the factors above are unlikely to go into reverse any time soon. We see no modern-day Paul Volcker on the horizon, determined to return the world to the rule of sound money.
Preparation for the next 25 years
Over the last 25 years, markets are changed in form but not in nature – the instruments are new, but the enthusiasms familiar. Our task for the next quarter century is, as ever, to resist the temptation of what glitters, be dynamic when it matters, and hold fast to what endures.
[1]A thematic ETF is an exchange-traded fund focused on a single long-term trend, investing across sectors and regions to capture a specific idea
[2] Bloomberg
[3] https://www.ft.com/content/ef885f08-ab95-4190-8d48-23b8068b9da7
Please refer to Troy’s Glossary of Investment terms here.
The information shown relates to a mandate which is representative of, and has been managed in accordance with, Troy Asset Management Limited’s Multi-asset Strategy. This information is not intended as an invitation or an inducement to invest in the shares of the relevant fund.
Performance data provided is either calculated as net or gross of fees as specified in the relevant slide. Fees will have the effect of reducing performance. Past performance is not a guide to future performance. All references to benchmarks are for comparative purposes only. Overseas investments may be affected by movements in currency exchange rates. The value of an investment and any income from it may fall as well as rise and investors may get back less than they invested. Neither the views nor the information contained within this document constitute investment advice or an offer to invest or to provide discretionary investment management services and should not be used as the basis of any investment decision. There is no guarantee that the strategy will achieve its objective. The investment policy and process may not be suitable for all investors. If you are in any doubt about whether investment policy and process is suitable for you, please contact a professional adviser. References to specific securities are included for the purposes of illustration only and should not be construed as a recommendation to buy or sell these securities.
Although Troy Asset Management Limited considers the information included in this document to be reliable, no warranty is given as to its accuracy or completeness. The opinions expressed are expressed at the date of this document and, whilst the opinions stated are honestly held, they are not guarantees and should not be relied upon and may be subject to change without notice. Third party data is provided without warranty or liability and may belong to a third party.
Although Troy’s information providers, including without limitation, MSCI Solutions LLC and its affiliates (the “ESG Parties”), obtain information from sources they consider reliable, none of the ESG Parties warrants or guarantees the originality, accuracy and/or completeness of any data herein. None of the ESG Parties makes any express or implied warranties of any kind, and the ESG Parties hereby expressly disclaim all warranties of merchantability and fitness for a particular purpose, with respect to any data herein. None of the ESG Parties shall have any liability for any errors or omissions in connection with any data herein. Further, without limiting any of the foregoing, in no event shall any of the ESG Parties have any liability for any direct, indirect, special, punitive, consequential or any other damages (including lost profits) even if notified of the possibility of such damages.
All references to FTSE indices or data used in this presentation is © FTSE International Limited (“FTSE”) 2025. ‘FTSE ®’ is a trade mark of the London Stock Exchange Group companies and is used by FTSE under licence.
Issued by Troy Asset Management Limited, 33 Davies Street, London W1K 4BP (registered in England & Wales No. 3930846). Registered office: 33 Davies Street, London W1K 4BP. Authorised and regulated by the Financial Conduct Authority (FRN: 195764) and registered with the U.S. Securities and Exchange Commission (“SEC”) as an Investment Adviser (CRD: 319174). Registration with the SEC does not imply a certain level of skill or training. Any fund described in this document is neither available nor offered in the USA or to U.S. Persons.
© Troy Asset Management Limited 2025.