




Hello from the dark side of the moon
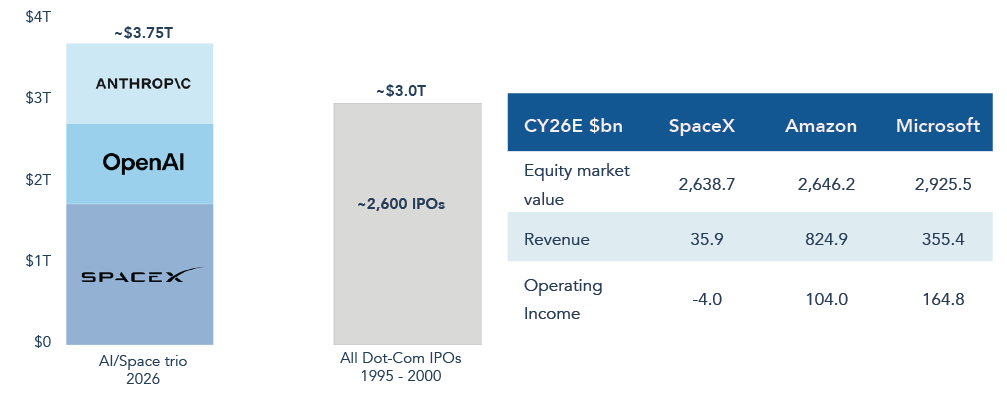
SpaceX’s listing on public stock markets is a symbolic and revealing moment. Alongside Anthropic and OpenAI, it is the first of the ‘Big 3’ initial public offerings (IPOs) expected to come to an equity bull market for which new share issues have hitherto been conspicuous by their absence. The contrast with the dot com era is hard to ignore. Rather than thousands of tiddly companies with nascent financial results, this generation of IPOs are ginormous companies with large and growing revenues. The inflation-adjusted value of these three companies is expected to be substantially greater than the total value of all the ~2,600 IPOs that took place between 1995 and 2000. In its first week of trading, SpaceX’s market value reached similar levels to Amazon and Microsoft, despite its operating losses and far smaller revenue base.
FIGURE 1 – EXPECTED IPO VALUE OF SPACEX, ANTHROPIC AND OPENAI VS. ALL DOT-COM IPOS
Source: Paul Kedrosky, 16 June 2026. Past performance is not a guide to future performance. Estimates may not be achieved. The reference to specific securities is not intended as a recommendation to purchase or sell any investment.
With investors’ imaginations riding rocket ships, the Strategy’s performance is in the mud. We have lagged the market in the past, but for the Strategy to be markedly down, whilst the market is up, is highly unusual and disappointing. It is tempting to brush this off as a short-term blip or an anomaly, to be corrected over time. There’s further temptation to find something or someone to blame. This Letter offers no excuses. The disappointment is real and the responsibility for it is wholly ours.
What follows is an explanation as to how we got to this situation and how we see the way out. We begin by exploring why it is we have avoided the hottest parts of the market before giving three examples of companies in the Strategy whose share prices have recently delivered poor returns. We present our perspective, what we are watching, and why we continue to have conviction in their future.
We’re not in Kansas anymore
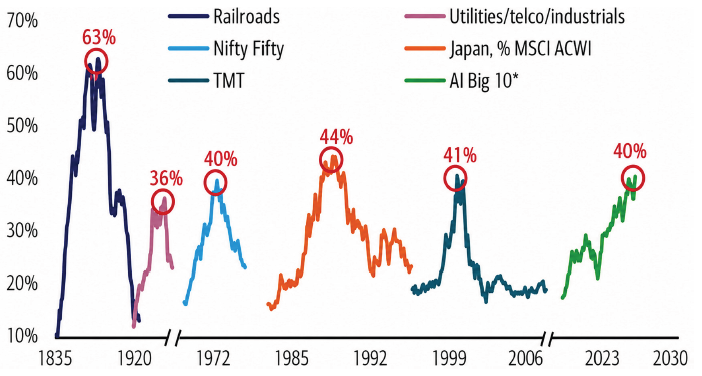
It doesn’t take Dorothy’s Toto to know that advances in Artificial Intelligence (AI) are by far the biggest driver of shareholder returns this year, both to the upside (for hardware) and the downside (for software). The upside is best expressed by the meteoric rise of semiconductor companies (‘semis’). Not even the Iran war and an oil price shock could stop this. In fact, since the beginning of the war, ~75% of the MSCI World Index’s gain can be attributed to the extraordinary returns from semis and tech hardware. This has meant that the percentage of US stocks outperforming is at a 35-year low, and by one measure, just ~40 companies account for roughly a half of the US index, all of which are a bet on continued AI capital expenditure (‘capex’). This level of equity concentration is usually associated with stock market peaks.
FIGURE 2: THE BUBBLE HISTORY OF STOCK MARKET CONCENTRATION, MEASURED AS A % OF US MARKET CAP
*AI Big 10= Magnificent 7 +Broadcom, AMD, Micron. TMT= Technology, Media, Telecommunications. Nifty Fifty= 50 large-cap stocks on the New York Stock Exchange in the 1960s and 1970s. Source: Bank of America Global Investment Strategy, GFD Finaeon, Bloomberg, 31 May 2026. Past performance is not a guide to future performance. Note: Japan is measured as % of MSCI ACWI, all others are as % of US stock market.
AI optimism meets risk management
We are not AI doomers. We use the technology in our daily work and recognise its transformative potential across industries. The Strategy is significantly invested in AI through ownership of the hyperscalers –deliberately targeting AI’s infrastructure and application layer to capture rapidly growing demand. What we haven’t done is invest deeper on the supply side by owning the hardware companies essential to enable the construction of AI infrastructure; the chips, networking gear, racks, cooling equipment, and power. Why not? Because high expectations combine with deep uncertainty about AI’s future economics.
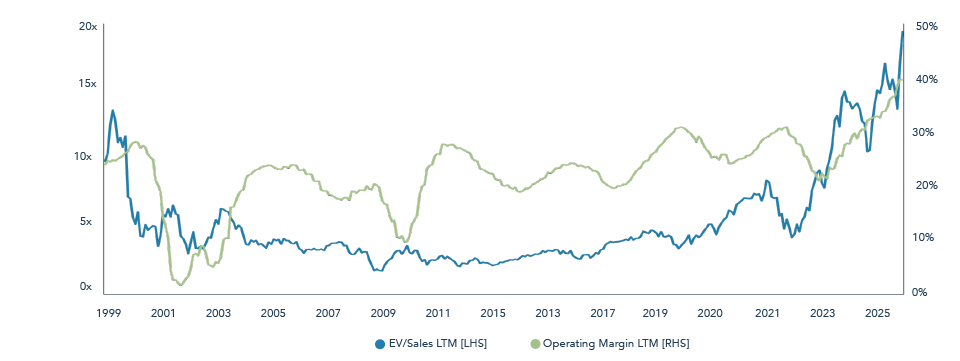
Valuations price in ongoing strength as the market ascribes rich valuation multiples to cyclically high profit margins. That’s sustainable if growth and profitability hold up, which they might, but current share prices leave little room for disappointment.
FIGURE 3: SEMIS ENTERPRISE VALUE-TO-SALES AND SECTOR PROFIT MARGINS
Source: FactSet, 30 June 2026. Past performance is not a guide to future performance. LTM = Last 12 months. Please refer to Troy’s Glossary of Investment Terms.
Our doubts about the durability of returns stem from several interrelated concerns.
1. The cyclicality of semis and the inevitability of capital cycles. The semis sector has always been highly cyclical, yet the consensus assumes this time is different and that outstanding secular growth at high margins will persist for years. History runs firmly against this conclusion. As Nassim Nicholas Taleb once wrote, “I’ve seen gluts not followed by shortages, but I have never seen a shortage that hasn’t led to a glut”. Morgan Stanley estimates hyperscaler capital expenditure alone (excluding neoclouds) will surpass $1 trillion in 2027 – three times the peak of the dot-com fibre build-out as a proportion of GDP. The differences with 2000 are important. One important difference is that the scale of capital deployment is far larger.
Investors will also note, correctly, that this capex is funded from the operating cash flows of some of the largest and most profitable companies ever created – not from debt, equity, and land grants that brought fragility to the dot-com era. We believe the hyperscalers will be rational with their capital. But rationality dictates erring towards overspending rather than underspending; the former risks indigestion, the latter is existential. As Alphabet CEO Sundar Pichai put it in 2024: “When we go through a curve like this, the risk of underinvesting is dramatically greater than the risk of overinvesting… not investing to be at the front here definitely has more significant downside.”
2. Fragile economics further down the chain. Behind the cash-rich hyperscalers, the picture is more precarious. The neoclouds – CoreWeave, Nebius, Crusoe, Lambda, and others – are highly indebted entities with aggressive expansion plans, set to grow from roughly 10% of hyperscaler capacity in 2025 to 30–40% in the coming years. They form a soft underbelly with potential to be disruptive marginal suppliers if supply ever exceeds demand.
The leading AI labs face their own daunting hill towards self-sufficiency. Revenue growth at Anthropic and OpenAI is phenomenal, but their end-state economics are far from assured. The R&D and service costs of large language models (LLMs) are enormous, resulting in big ongoing losses that make the labs dependent on external funding – including, notably, from NVIDIA and the hyperscalers themselves (the much-discussed ‘circular financing’). The durability of their technological leadership and pricing power is unproven. Cheaper open-source models suggest commoditisation sits just behind the frontier, while growing political interference slows progress. Current optimism assumes the big labs will be good for their contracted bills. We are not so sure.
3. Supply and demand may be less imbalanced than it appears. Every hyperscaler currently reports demand exceeding supply, and we don’t doubt their individual positions. But in aggregate, we may be closer to equilibrium than their statements imply. We are in an aggressive expansive phase where multiple participants are fighting simultaneously for compute, products, and customers. NVIDIA has deliberately engineered scarcity to diversify its customer base – leaving neoclouds with too much capacity and hyperscalers with too little.[1] In this environment, hyperscalers naturally over order to crowd out rivals and secure supply, sending exaggerated pricing signals throughout the chain.
The hyperscalers are also among the largest, most innovative, and most sophisticated capital spenders on the planet – highly motivated to extract maximum value from their assets. Anyone earning supernormal profits in a cyclical, technology-driven supply chain is therefore at risk. We have historically avoided tech hardware because it is subject to fast, unpredictable development cycles. Given the scale of capital deployment and compute scarcity, it is hard to believe AI’s development won’t take sudden turns. As Microsoft CEO Satya Nadella likes to say: “we are just one innovation away from the entire regime changing”.[2]
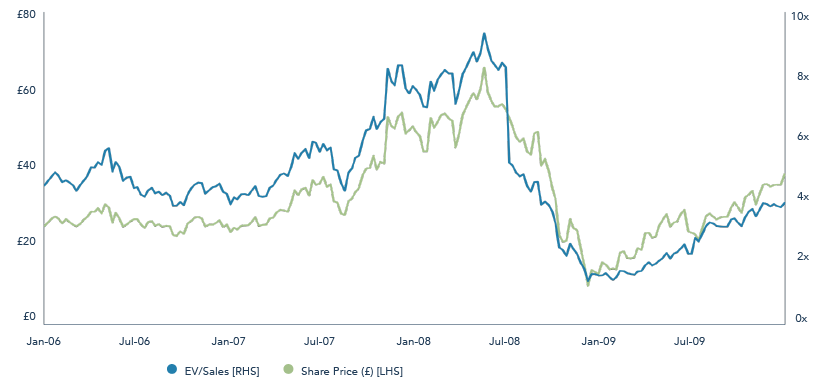
This year reminds us of 2007 when miners were all the rage. Commodity prices were at their highs, China was growing its economy at +10–15% annually, the industry was supply-constrained, and miners enjoyed supernormal profits. Animal spirits ran wild. Rio Tinto’s share price nearly doubled in 2007, added another third in the first half of 2008, and peaked at double their historic average EV/Sales multiple, partly fuelled by BHP Billiton’s hostile bid.[3] Those who avoided the froth, Gabrielle among them, vividly recall being told that they “don’t get it”. Rio’s share price then fell -85% in roughly six months as the Global Financial Crisis (GFC) shattered perceptions of supply and demand. It took over a decade to reclaim those highs.[4]
FIGURE 4: RIO TINTO 2006 TO 2010
Source: Bloomberg, 30 June 2026. Past performance is not a guide to future performance.
We recall this episode not to predict a financial crisis or imminent collapse. Nor do we suggest AI hardware companies sell commodities. It is a reminder, however, that intelligent, well-informed people can extrapolate the status quo to mistake a capital cycle for a permanent structural shift. Buying something popular and highly priced need not result in capital loss, unless sold out at the lows. It can, though, deliver modest returns for a very long time. We would become more constructive about semis and tech hardware if the following conditions can be met: valuations were lower after adjusting for where we are in the market cycle; supply and demand were to find a more stable and rational equilibrium; and we gained greater confidence in the long-term economics underpinning AI spending.
The Strategy’s investments in the hyperscalers are not without risk in the short term. Returns on invested capital are falling and competitive forces have intensified. Our continued optimism stems from their broad opportunity to monetise their investments through both internal and external AI workloads, and the flexibility that this brings to their capital planning. We expect returns on investments to improve over the medium term as revenue expands and the companies find ways to increase the efficiency of their spending, including through the development of their own custom silicon, models and software. This places them in a relatively strong position when the capital cycle inevitably turns.
The other game in town
George’s relative Robert works for a British TV sports production company and he and his colleagues chose New York City as their base to cover the 2026 FIFA World Cup. For the first few days of the tournament Rob and his colleagues were bewildered as the locals cared nothing for the ‘soccer’ to focus all their attention on the New York Knicks’ first NBA Championship in 53 years. Many of the Strategy’s stocks have experienced comparable neglect whilst the action takes place elsewhere.
Neglect suggests business as normal, to some degree. The Strategy’s negative returns show that a broad collection of our companies have attracted plenty of attention, but for the wrong reasons. In terms of attribution, owning software stocks over the past six months has cost the Strategy about the same amount (five percentage points of relative returns) as not owning anything in the semis and tech hardware sectors. This pattern is replicated to a lesser extent outside of Technology – owning payments (approximately -2%) instead of banks and capital markets (approx. -2%) in Financials; information services (approx. -2%) rather than capital goods in Industrials (approx. -1%). In this next section we highlight three companies that have recently delivered disappointing returns. For each we explore the bear case, how we interpret it, and what we are watching that could change our minds.

Visa’s shares are -1% (in GBP) since the start of the year, recovering from a -16% peak-to-trough drawdown, and responding to anxiety in four areas:
- Agentic commerce as a disintermediation threat. If autonomous agents are to execute purchases, critics argue the card credential becomes one option among many. Google, OpenAI/Stripe, and Coinbase are all developing agent-native protocols that could theoretically route transactions outside card networks entirely.
- Stablecoins as a cost-competitive alternative. Structurally lower transaction costs make stablecoins attractive for cross-border and B2B flows. The US GENIUS Act gives regulatory cover for Stripe and others to build stablecoin infrastructure, and merchants – longstanding critics of swipe fees – may increasingly steer volume away from card networks.
- Regulatory overhang. The Credit Card Competition Act (CCCA) in the US, the Department of Justice (‘DOJ’) antitrust lawsuit targeting Visa’s US debit dominance, and the pending interchange settlement with merchants collectively put a cloud over the fee structure that has underpinned Visa’s economics for decades. Even if the probability of each individually is modest, the cumulative noise depresses the valuation.
- A maturing cash-displacement tailwind. Visa’s business has long benefited from being a critical intermediary enabling the transition from physical cash payments to digital transactions made with card credentials. With US card penetration now 72% of consumer payment volume, up from 58% a decade ago, there is a growing concerns that future volume growth will be lower, more GDP-dependent, and more cyclical.
We believe each element of the bear case is overstated or misunderstood.
- Agentic commerce. Whilst we have our various doubts as to why agentic commerce will not be adopted quite as fast as its leading proponents suggest, the networks are not passive bystanders.[5] Visa has launched its Intelligent Commerce Platform and Trusted Agent Protocol; Mastercard has Agent Pay. Authentication, delegated consent, fraud liability, and dispute resolution are precisely the problems card networks have spent decades solving. Money movement is a commodity, but globally networked acceptance, governance and security are not. The Apple Pay experience is instructive here. When Apple launched its own payments layer twelve years ago, many feared commoditisation and disintermediation. Instead, Apple used the networks – Visa, Mastercard and American Express – as a distribution and settlement layer thereby accelerating card adoption. We see the networks’ role as enhanced, not diminished, in an agentic world, unlocking new revenue opportunities.
- Stablecoins. The narrative confuses infrastructure with competition. Stablecoins have product-market fit in B2B cross-border, treasury management, and EM corridors with volatile currencies – markets traditionally served by banks, not cards. Visa is opening its network to this opportunity. It has 130+ stablecoin-linked card programmes and grew its stablecoin settlement volume from $0.1bn to $4.6bn annualised in 2025. In developed-market consumer-to-merchant payments, the chicken-and-egg adoption problem (requiring scale on both sides of the consumer-merchant divide), transaction irreversibility, and absence of credit features make near-term displacement unlikely, in our view.
- Regulation. The CCCA has stalled since 2023 as its primary champion in the Senate is retiring. The DOJ debit case won’t reach trial before 2027–28, and in any case US domestic debit is a mid-teens percentage of net revenue – a manageable exposure. A final merchant settlement approval in late 2026 would be a net positive, in our opinion, as it would remove the risk of a trial. We expect banks to cede economics in a settlement rather than the networks, consistent with past regulatory intervention on card interchange.
- Cash displacement. The global picture is considerably more constructive than the US-centric bear case implies. Consumer-to-business payments are a $40tn volume market, 64% card-penetrated, with ~$11tn of cash and cheque opportunity remaining. The 10 largest continental European markets hold over 20% of that opportunity, with few competing alternative payment methods proliferating, unlike India or Brazil. Even in the most mature markets, growth is not exhausted: Visa grew Nordic revenues at ~15% CAGR between FY22–24 despite 90%+ digital payment penetration.[6]
Beyond geography, card volume growth understates the revenue opportunity. Processed transactions grow faster than dollar volumes, and Visa derives over one-third of gross revenue from the number of transactions, forming a base that benefits disproportionately from small-ticket items, tokenisation and agentic commerce growth. Value-added services (tokenisation, fraud analytics, cybersecurity, open banking, issuer processing) now represent ~30% of revenues, growing +25% year-on-year. Visa’s revenue model is transitioning from a cash-to-card conversion story toward more expansive services and infrastructure, making revenue structurally less dependent on consumer spending volumes.
We are watching three things that, if they materialised would cause us to reassess:
- Protocol consolidation outside the networks. The agentic payment landscape is currently fragmented. If a non-network protocol achieved dominant adoption among merchants, chatbots and agents – particularly one built on stablecoin settlement – the governance advantage we ascribe to Visa could erode faster than we anticipate. We are watching merchant adoption data and Visa’s agentic commerce partnerships closely.
- Broad-based stablecoin adoption in consumer payments. Current stablecoin volume in consumer-to-business retail is negligible relative to Visa’s $14tn+ annual card volume. If regulatory clarity, improving user experience, and merchant incentives drove mass adoption – particularly in online checkout – the risk of volume displacement would become real.
- Regulatory damage. An adverse DOJ debit ruling, or an escalation of merchant settlement terms beyond our assumptions, could impair US economics more meaningfully. A legislative vehicle for the CCCA remains unlikely but cannot be dismissed entirely.
We believe Visa can sustain low double-digit revenue growth in the medium term. At ~24x consensus earningsover the next 12 months, the shares trade at the low end of their long-term averages.[7] We find the risk vs reward compelling for a business with stable growth and exceptional economics.
FIGURE 5: VISA FINANCIAL METRICS

Source: FactSet and Troy Asset Management Limited, 30 June 2026 . Neither past performance or forecasted performance are guides to future performance. Characteristics are shown excluding banks, as banks are not directly comparable to non-financial companies due to their distinct balance sheet structures and regulatory frameworks. FCF measures are based on trailing figures over the last 12 months. NTM is next 12 months. Asset allocation subject to change. All references to benchmarks are for comparative purposes only.

Whereas Visa’s latest quarter revealed one of the strongest underlying growth rates in more than a decade, Alcon’s operating performance has been less than stellar. The shares are down -14% (in GBP) year-to-date. The market’s verdict is that execution has repeatedly disappointed and that the medium-term outlook for mid-to-high single digit revenue growth is no longer credible. Growth has slowed for two reasons:
- Stagnant implantables growth. Whilst tariffs and investment spending have had an impact on earnings in the near term, the bear case is mostly focussed on Alcon’s intraocular lens (IOL) franchise for cataracts surgery. Implants account for ~17% of total group sales and the premium end of this segment is one of the highest-margin and, historically, one of the faster-growing parts of the business. Segment growth has slowed to the low-single-digits under weaker US procedure volumes and intensifying competition. With last year’s soft trends recurring, investor patience is running thin.
- Contact lens slowdown. A secondary concern is a reduction in growth for contact lenses from the high-single digits to the mid-single digits. Market growth is weaker as pricing in European markets moderate, and Alcon’s share gains have diminished as product launches mature.
We share the disappointment. We also take a broader perspective. Implant competition has proven fiercer than we anticipated and category growth has unexpectedly slowed. Yet Alcon’s ophthalmology portfolio is very broad, and management gets too little credit for their long track record for execution and innovation.
- For implantables. We expect new product launches to stabilise market share in the coming 12 months, and for new industry capacity in the US to restore category growth. Near-term implant share pressure does not change the long-run economics of owning the leading IOL franchise in a market (covering equipment, implants, and surgical consumables) with decades of growth ahead.
- For contacts. Underlying growth is healthier than the headlines suggest as Alcon deliberately retires older lines in favour of newer ones. We are encouraged by launches in the higher margin reusable segment, where Alcon is under-represented. Diminished pricing power is partly cyclical, following outsized 2023-2024 increases and soft consumer confidence. Alcon continues to win international share, and the industry remains a disciplined oligopoly based on patient and optician loyalty and manufacturing complexities.
Elsewhere, performance is encouraging. Alcon is successfully innovating and commercialising products across surgical equipment, over the counter (OTC) and prescription medicines. It stands at the start of a 10-year cataracts surgical equipment replacement cycle, diving strong near-term equipment sales and pulling through revenue for premium-priced surgical consumables. Alcon’s Ocular Health segment – OTC and prescription medicines, primarily for dry eye – is of a similar size and profitability to surgical implants and grew +10% in the latest quarter, driven by new product launches.
What are we watching that might change our minds?
- Implantables growth fails to recover, and Alcon cedes share despite new product introductions.
- Contact lens growth fails to improve, even as older products shrink as a share of the portfolio and Alcon gains in the reusable segment.
- Other products in the portfolio do not scale sufficiently to offset implant/lens softness to drive overall growth and profitability.
Balancing the short term against the long term. We do not dismiss the slowdown in important ophthalmic categories or the execution risk required to address it. We also find the quality of Alcon’s assets – distribution, brands, R&D engine, and position in a structurally attractive oligopoly – are intact. Trading at their historical lows, the company’s shares price in continued disappointment and structural impairment, offering an attractive opportunity to own the global leader in ophthalmology, with the broadest product range, the deepest pipeline, and a defensible competitive position. We expect Alcon to reassert their leadership with new products, directed by a management team that has transformed and revitalised the business over the past decade via continuous reinvestment, innovation and strong execution.
FIGURE 6: ALCON FINANCIAL METRICS

*Alcon’s ROIC is depressed because of legacy intangible assets accumulated when it was acquired by Novartis. ROIC excluding all intangibles is ~19% and gives a truer reflection of the company’s capital efficiency.
Source: FactSet and Troy Asset Management Limited, 30 June 2026 . Neither past performance or forecasted performance are guides to future performance. Characteristics are shown excluding banks, as banks are not directly comparable to non-financial companies due to their distinct balance sheet structures and regulatory frameworks. FCF measures are based on trailing figures over the last 12 months. NTM is next 12 months. Asset allocation subject to change. All references to benchmarks are for comparative purposes only.ay 2026. Past performance is not a guide to future performance. Free Cash Flow measures are based on trailing figures over the last 12 months. Estimates may not be achieved. All references to benchmarks are for comparative purposes only.

Amadeus has been a significant detractor from performance over the past year, with the shares falling -20% year-to-date. The market has designated Amadeus as an “AI loser” whilst the war in Iran poses additional immediate challenges to the airline industry. The structural concern has two angles that cover both sides of Amadeus’s business.
- The death of the Global Distribution System (‘GDS’). Amadeus’s Air Distribution business connects travel agents with airlines. The bear case argues that AI agents will disintermediate the GDS as a booking channel, as the internet and direct connections were each supposed to do before them.
- Software disruption. Amadeus is ensnared in the pervasive bear case for enterprise software – competitive intensity increases as AI agents replace human-operated systems, enterprises build their own tools, and third-party licence and seat counts will fall. A sector with high recurring revenues faces structurally higher risk of customer churn and pricing pressure.
We think the market underestimates the complexity and fragmentation of the travel industry and Amadeus’s unique position in it, thereby conflating two risks and overstating both. A compelling growth opportunity is therefore overlooked.
- On GDS. The risk is credible, but the business has survived disintermediation threats for twenty years, with volumes proving highly resilient. Airlines operate in a competitive, low-margin, safety-obsessed industry and Amadeus’s corporate and international volumes, where GDS is concentrated, are some of the airlines’ most valuable customers. Airlines change distribution at the pace of the slowest, most risk-averse participant. On the other side of the network, Amadeus’s data are deeply embedded into the workflows and economics of travel agents and corporate travel management companies. AI does not displace their compliance frameworks and incentives. If agentic AI does emerge as a separate booking channel, Amadeus is better placed than heavily indebted rivals Sabre and Travelport to connect to it. And in any case, GDS is a declining share of the business as higher-margin IT segments expand.
- On Air IT. The standard seat-based software bear case simply does not apply to Amadeus because it charges per passenger boarded, not per licence. Revenue therefore scales with passenger volumes, not employee headcount, making Air IT a variable customer cost – an attractive model for low-margin airlines. Beyond the pricing model, the structural durability is exceptional. Amadeus’s core Passenger Service System (‘PSS’) is the operational hub of an airline, managing inventory, reservations, departure control, 24/7, across hundreds of integrations. Migration for these systems is described as open-heart surgery; in practice it is closer to a brain transplant mid-conversation. Contracts run for a decade. In the last five years, only four airlines with more than 10 million passengers changed PSS provider – all four moved to Amadeus. With ~70% contribution margins and over €1.5bn in annual R&D, Amadeus can price out any new entrant.
We do not see Air IT as a business to be defended. The industry’s ongoing transition to modern systems structurally lifts revenue per passenger as airlines run old and new systems in parallel and modularity creates a clearer path to cross-selling new functionality. With ~50% market share and industry-leading technology, we estimate this dynamic alone adds materially to the medium-term earnings trajectory.
The opportunity beyond airlines is similarly underappreciated. Amadeus’s Hospitality and Other Solutions business is growing quickly, leveraging data-centric cloud infrastructure originally built for airlines and now applied across hotels, ground transport and other travel verticals. Agentic AI is an enabler here, accelerating expansion into existing markets and extending into new ones.
What are we watching that would cause us to change our views?
- Major airline carriers granting content parity to AI channels – or systematically excluding GDSs from them – with meaningful booking volumes following.
- Travel management companies and travel agents migrating to AI-native booking tools within a few years, accelerating GDS revenue erosion.
- Any PSS customer loss to a competitor or new entrant would challenge our confidence in the stickiness of the Air IT franchise.
At 14x estimated earnings over the next 12 months, pessimism appears excessive. If Air Distribution’s earnings went to zero immediately and permanently – the worst possible outcome – the remaining Air IT and Hospitality businesses would likely be worth above the current share price. The market is pricing in something worse than total, immediate GDS extinction, while ascribing no value whatsoever to the significant growth opportunities in Air IT modernisation and travel adjacencies.
FIGURE 7: AMADEUS FINANCIAL METRICS

Source: FactSet, Troy Asset Management Limited and Amadeus, 30 June 2026 . Neither past performance or forecasted performance are guides to future performance. Characteristics are shown excluding banks, as banks are not directly comparable to non-financial companies due to their distinct balance sheet structures and regulatory frameworks. FCF measures are based on trailing figures over the last 12 months. NTM is next 12 months. Asset allocation subject to change. All references to benchmarks are for comparative purposes only.
Contrasting fortunes brings opportunity
This has been a very challenging and disappointing period for the Strategy, testing everyone’s patience. We remain focused on companies with privileged business models, strong competitive advantages, high financial productivity, and solid balance sheets – owned at valuations that justify expectations for attractive long-term returns. We continue to believe that the compounding growth of these companies cash flows will ultimately drive returns to their share holders.
Uncertainty in equity markets is high. We believe that in extreme periods such as this, when investor capital floods into a single theme, the patient ownership of exceptional businesses will be rewarded. Our companies continue to operate well, generate substantial cash, and reinvest to extend their growth. In the excitement for new technology, their customer value propositions and adaptability should not be underestimated. Where valuations already price in negative outcomes, we see grounds for encouragement.
Part of the underperformance reflects our deliberate caution. We take a multi-year view, weighing growth potential against competitive and other risks. Today’s market leaders may continue to rise if extraordinary capital expenditure programmes persist and the risks we identify prove illusory. We doubt current trajectories and rich valuations will escape serious challenge. For this reason, we continue to avoid them for now.
The remainder reflects a combination of investment mistakes and controversies. Companies such as Alcon have fallen short of expectations. Others, including Visa and Amadeus, face near-term controversies that weigh on sentiment despite their solid operating performance. We engage deeply and frequently with these debates and reach conclusions that are different from what current valuations imply. The business landscape is dynamic, and we approach each situation with an open mind. We are prepared to change our views, but only on the basis of deep analysis and hard evidence, not speculative narratives.
At a portfolio level, we are attuned to the correlated risks across businesses operating in the digital economy. We maintain conviction in the companies that have been marked down to valuation lows, leaning in where appropriate, and leaning out when the facts change. We stay true to our investment discipline whilst aiming for a portfolio that exposes investors to a diverse set of opportunities. The Strategy’s underlying companies are valued at discount to the wider market, despite far superior financial productivity. We believe this creates a clear opportunity for improved returns.
We back our conviction with our own money, and we continue to add proactively to our holdings of the Strategy.
Thank you for your continued interest and confidence in the Strategy. We aim for transparency and honesty in our communications. Please do not hesitate to contact us with any questions you may have.
[1] As evidenced by xAI’s recent deals to rent their NVIDIA chips to Anthropic and Google.
[2] On device and on-premise AI computing have potential to be disruptive for more basic non-agentic AI applications. And whilst Elon Musk’s data centres in space may appear far-fetched, we would not rule the idea out altogether.
[3] Enterprise value-to-sales (EV/sales) is a valuation metric that compares a company’s total value to its annual revenue. Lower ratios may indicate more attractive valuations.
[4] A relevant postscript to Rio’s decline is that the shares made a rapid recovery in 2009 and 2010, because the predictions about demand for minerals from the Chinese economy were partly correct, at least compared to the West. The shares then rolled over when Chinese demand structurally slowed.
[5] Our doubts include merchants’ readiness and willingness, and the fact that many humans take pleasure in the shopping experience, or will not trust an agent to act on their behalf.
[6] CAGR stands for Compound Annual Growth Rate
[7] Consensus earnings refers to the market’s average forecast of the company’s earnings over the next 12 months, compiled from estimates by the analysts who cover the company.
[8] Alcon’s ROIC is depressed because of legacy intangible assets accumulated when it was acquired from Novartis. ROIC excluding all intangibles is ~19% and gives a truer reflection of the company’s capital efficiency.
Please refer to Troy’s Glossary of Investment terms. The information shown relates to a mandate which is representative of, and has been managed in accordance with, Troy Asset Management Limited’s Global Equity Strategy. This information is not intended as an invitation or an inducement to invest in the shares of the relevant fund. Performance data provided is either calculated as net or gross of fees as specified in the relevant slide. Fees will have the effect of reducing performance. Past performance is not a guide to future performance. This presentation may also contain forward-looking statements that are based on current expectations, estimates, forecasts, and projections. These statements are not guarantees of future performance and involve certain risks and uncertainties which are difficult to predict. All references to benchmarks are for comparative purposes only. Overseas investments may be affected by movements in currency exchange rates. The value of an investment and any income from it may fall as well as rise and investors may get back less than they invested. Neither the views nor the information contained within this document constitute investment advice or an offer to invest or to provide discretionary investment management services and should not be used as the basis of any investment decision. There is no guarantee that the strategy will achieve its objective. The investment policy and process may not be suitable for all investors. If you are in any doubt about whether investment policy and process is suitable for you, please contact a professional adviser. References to specific securities are included for the purposes of illustration only and should not be construed as a recommendation to buy or sell these securities. Information on the risks of the investment in the fund can be found in the Prospectus. Although Troy Asset Management Limited considers the information included in this document to be reliable, no warranty is given as to its accuracy or completeness. The opinions expressed are expressed at the date of this document and, whilst the opinions stated are honestly held, they are not guarantees and should not be relied upon and may be subject to change without notice. Third party data is provided without warranty or liability and may belong to a third party. Issued by Troy Asset Management Limited, 33 Davies Street, London W1K 4BP (registered in England & Wales No. 3930846). Registered office: 33 Davies Street, London W1K 4BP. Authorised and regulated by the Financial Conduct Authority (FRN: 195764) and registered with the U.S. Securities
and Exchange Commission (“SEC”) as an Investment Adviser (CRD: 319174). Registration with the SEC does not imply a certain level of skill or training. Any fund described in this document is neither available nor offered in the USA or to U.S. Persons.
© Troy Asset Management Limited 2026.