Had you fallen asleep at the start of the year, only to be revived six months later, you might be forgiven for thinking that markets were similarly sedate. Of course, the first half of the year has been anything but dull, mainly thanks to the return of Donald Trump as US President, and the actions of his domestic and international allies.
Figure 1: Troy Global Equity Strategy YTD performance 2025

Source: FactSet, 30 June 2025. Past performance is not a guide to future performance. All references to benchmarks are for comparative purposes only.
A slump in the US dollar also means that returns are defined by the currency in which they are denominated. Sterling-based investors in the Strategy experienced a modest decline, whereas solid progress was made when returns are measured in USD.
The Strategy’s returns were strongly positive in January. The Strategy then protected relatively well through to April as volatility spiked in response to the risks posed by higher tariffs. However, stock-specific drags from the likes of Alcon and Fiserv – driven by deteriorating sentiment rather than significantly weaker fundamentals – meant that the Strategy’s rebound in May was comparatively subdued, and June was poor. This is despite steady earnings growth from the portfolio’s companies and the Strategy being relatively well insulated from the first-order effects of higher tariffs.
Figure 2: Troy Global Equity Strategy monthly performance YTD 2025

Source: FactSet, 30 June 2025. Past performance is not a guide to future performance. All references to benchmarks are for comparative purposes only.
The Strategy also defied some market-wide trends. Tech was a tailwind for us rather than a headwind. Meta Platforms and Microsoft were significant positive contributors to the Strategy, together with other tech companies Intuit and Take-Two Interactive Software. Europe was a mixed bag. Whilst Heineken was among the largest positive contributor to returns, other European holdings including LVMH and Diageo fared less well.
Figure 3: Year to date stock attribution
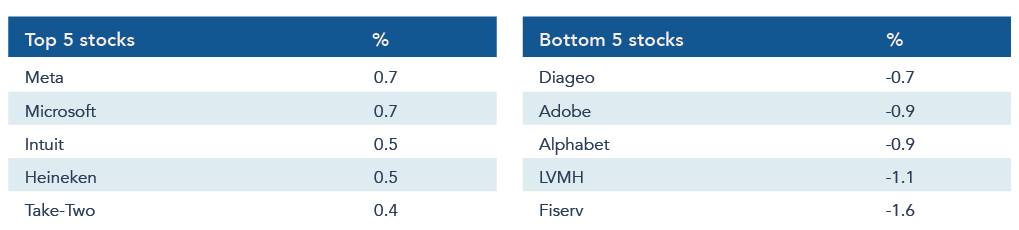
Source: FactSet, 30 June 2025 . Past performance is not a guide to future performance. Contribution to return is provided as gross absolute returns in base currency and does not include charges and fees. Asset allocation subject to change. Reference to specific securities in this slide is not intended as a recommendation to purchase or sell any investment.
We made no dramatic changes to the portfolio over the past six months. We’ve taken money out of several payments companies after a very strong run for their shares and a re-rating in valuations. They remain a core part of the Strategy. The sales funded increased investment in areas where growth is similarly strong and consistent, but where valuations are more appealing, including Adobe. We took advantage of the sell-off in US tech at the start of April to add to Alphabet and Microsoft. Lastly, the exit from Medtronic was precipitated by uncertainties about their ability to navigate higher tariffs. On balance, we believe these changes improve the quality of the portfolio whilst preserving the appeal of its valuation.
In aggregate, the Strategy’s companies have continued to grow at a healthy rate. Earnings per share have grown at approximately +10% over the past 12 months, ahead of the MSCI World Index, and the capital efficiency of this growth remains outstanding.1 This means that, given the slight setback to performance in the first half of the year, the valuation of the Strategy has become more attractive.
Figure 4: Significant transactions year to date 2025

Source: FactSet, 30 June 2025. The reference to specific securities in this is not intended as a recommendation to purchase or sell any investment. The reference to transactions above is not indicative of all transactions in the period.
Figure 5: Portfolio Characteristics

Source: FactSet, 30 June 2025. Neither past performance nor forecasted performance are guides to future performance. All references to benchmarks are for comparative purposes only. Characteristics are shown excluding banks. Free Cash Flow Margin is a profitability ratio that measures a business’ cash from operating activities, less capital expenditure, as a percentage of its revenue over a given period. Free Cash Flow Yield is a financial valuation ratio that divides the free cash flow a company earns against its market value. ROIC is a measure of financial performance that calculates how efficiently a company’s management is
utilising all forms of capital available. EBITDA is a ratio measuring the amount of income generated and available to pay down debt before covering interest, taxes, depreciation, and amortisation expenses. P/E is Price to Earnings.
No extra points for originality
We are often asked a politely phrased version of the following question: ‘Why should I pay you to own [X] stock?’, with ‘X’ invariably being a big household name, based in the US, which has delivered fantastic results for investors. Alphabet, Microsoft or Visa are three popular examples.
The question is an important one that gets to the heart of our strategy and investment process. It also acknowledges that returns from global equities over the past decade have been defined by a small collection of large US companies. These same companies can be owned cheaply through a passive investment strategy. It further recognises that outperformance is harder, by definition, if everyone is crowded into the same large cap stocks.
A first response is to look backwards. The simple fact is that these companies have delivered material outperformance over many years. The same question was asked of us five and ten years ago, and these companies have thrived despite their large size and the scrutiny they receive. This does not appear to be a bubble set to burst. The companies in question have delivered outstanding shareholder returns that are backed by their operating performance. Of the four listed below, only Microsoft has significantly re-rated, but only to a level, in our view, which remains reasonable. Alphabet, Meta and Visa have delivered returns that have grown roughly in-line with the earnings and/or cashflows per share. Perhaps the onus is therefore on the doubters to explain why this pattern cannot continue!
Figure 6: Returns vs Operational Growth

Source: FactSet, 30 June 2025. Past performance is not a guide to future performance. TSR is total shareholder return. CAGR is compound annual growth rate. EPS is earnings per share. FCF is free cash flow.
Value hiding in plain sight
Why might this anomaly remain? There are many explanations, several of which are company specific. In general, we can point to the behavioural challenges of owning these stocks. Our own experience can be characterised as short-term pain for long-term gain. The pain largely originates from the very same thing that suggests sustainably high returns are unachievable; excessive attention, both from investors and competitors. Far from pricing these companies for perfection, the attention they receive results in endless ‘headline risk’ and unnerving swings in share prices. The size of these companies means that everyone has an opinion on them, no matter how well they are informed. Commentary is stimulated by the steady stream of competitors that these highly profitable companies attract. Not all the dedicated reporters, bloggers and analysts are motivated to give them a fair hearing.
What looks obvious and easy in hindsight is therefore far harder in real time. Our ownership of Meta since 2018 is the most extreme example, culminating in the gut-wrenching drawdown of 2022. The company is a lightening-rod for criticism, some of it deserved, much of it misplaced, in our opinion. Owning the shares can be exhausting. Less dramatic, but no less memorable, were the loud and confident venture capitalists who in 2021 claimed that buy-now-pay-later providers, Klarna and Affirm, would disrupt the card networks. The irony here is that these fintechs, and many others, chose instead to partner with Visa and Mastercard to take advantage of their ubiquity, reinforcing the card networks’ competitive advantages and growth potential.2
It takes more than just patience and grit to sit through these uncomfortable moments. Our conviction is based on deep research accumulated over many years of continuous ownership. This must look forwards as well as backwards, and it must be continuously updated for new information, involving qualitative insight and imagination as well as financial analysis. To do this we form perspectives on addressable markets, competitive strategy, management skill and reinvestment, none of which is easily captured in quantitative models. We’ve found that these companies have defied expectations because their addressable markets are far larger and more dynamic than is often appreciated. They also have management teams that have the intent and resources to invest to sustain highly profitable growth for the foreseeable future. Whereas a passive strategy will, in effect, ascribe a lower weight to an underperforming share, we tend to lean in and buy more when the share prices of our companies sell off significantly. This was the case with Meta in 2022 and Visa in 2021. Passive strategies also tend to be more diversified. We believe higher absolute returns are achievable by concentrating investors’ capital in these companies, and those with comparable characteristics, to the exclusion of all others.
Alphabet: A case study in patient investing
Alphabet is a live example of this in action. The company’s shares are lower this year because of the disruptive threat posed by the rapid growth of ChatGPT and other Large Language Models (LLMs).3 The threat is real, and the stakes are high. There are, however, several reasons why we remain optimistic about our investment in Alphabet. In summary, we highlight:
- The size and evolving nature of search
- Google’s AI-led innovation
- Google’s underappreciated competitive advantages
- Management’s steady and committed reinvestment
- Alphabet’s diversification, accelerated by AI
- A low valuation for Alphabet’s shares
Competition between LLMs and Google Search is often framed narrowly as a zero-sum game in which Google’s 10 blue links lose their monopoly status to new entrants. We believe this framing fails to recognise the size of the search market and how it has grown and evolved. Search is far larger and more fragmented than is commonly conceived, and as such, it supports the growth of multiple large players. The success of Booking Holdings in travel (also a large customer of Google’s) and Amazon’s retail marketing business (on track for $65bn in ad sales in 2025) are clear evidence for this.4 And whilst Google Maps and YouTube are also routinely excluded from the discussion, they can be reasonably considered as Google’s dedicated search engines for mobility and video. The growth of these various services in part comes from the continued expansion of ecommerce, which still only accounts for less than 25% of addressable US retail sales.5 Despite its age, the web continues to grow at a rapid pace because the internet has no physical constraints and there are no upper limits placed on human creativity and curiosity. In the last two years alone, the number of web pages that Google Search indexes has grown +45%.6 This suggests coexistence as much as competition in what is a large, dynamic and immature market.
Google Search has also evolved dramatically over the past decade as technology advances and computing becomes cheaper. Natural language processing for predictive terms in the Search box has improved speed and accuracy. Since Google has long focused on providing answers rather than links, 60% of searches result in no subsequent clicks. More recently, Google has introduced Circle to Search on Android and Google Lens, both of which expand Search further into multi-modal formats. Visual searches often have higher commercial applications, which is good news for the company’s ad revenues.
Figure 7: Circle Search (L), Google Lens (R)

Source: Google
LLMs create new possibilities for Search. The integration of Gemini, Google’s answer to ChatGPT, into the new AI Overviews and AI Mode, allows users to submit longer and more complex search queries for new use cases. Rather than simply substitute past behaviour, we are confident that LLMs expand the market for the retrieval and synthesis of web-based information.7 For Google, these new experiences promise to further transform Search from a ‘distribution mechanism [for the rest of the web] to an engagement sink’.8 Google’s management has said that engagement for AI Overviews is higher and continues to scale, and that ads inside AI Overviews already monetise at the same rate as traditional Search ads. It is conceivable that LLMs’ commercial value grows as they go from chatbots to personalised assistants. Google’s data and distribution advantages across multiple properties give it a unique position to deliver on this vision.
Whilst competitive analysis often centres on the company’s 15 products with over 500m users (and the oceans of data they confer), the evolution of Search is underpinned by three competitive advantages that are easily underestimated in the debate about LLMs. First, Google has over 25 years of technical expertise of running Search at huge scale, including the design of in-house processing chips (a substitute for NVIDIA’s) that are into their seventh generation. Closely related to this is a massive and highly complex global network of physical infrastructure that delivers Google’s various services efficiently to billions of people. And third, there is the world’s content creators, businesses, advertisers and other partners that are highly optimised for Google’s products. All three deliver performance and cost advantages that new entrants will struggle to replicate.
These interlocking strengths are all expressions of management’s commitment to innovate and reinvest with hundreds of billions of dollars spent each year on R&D, technical hardware, and real estate. Alphabet’s management is often maligned as wasteful and bureaucratic. They also deserve praise for betting early on transformative technology, accelerating the pace of internal innovation, and building a growing number of large and successful businesses. Whilst all the focus is on LLMs and Search, Alphabet’s diversification away from Search can be overlooked. We recall many investors were dismissive of Alphabet’s prospects to become a credible third-party cloud computing infrastructure provider to rival Amazon Web Services and Microsoft Azure. Google Cloud Platform (‘GCP’) is now a $50bn+ annual revenue business, growing at approximately +30%, with improving profitability. GCP and YouTube ad revenue represent a growing share of group revenues, in combination equal to ~25% of the total, outgrowing core Search, which has continued to compound at a very healthy double-digit rate.9 Far from being disrupted by AI, GCP and YouTube are clear beneficiaries from the technology.
Figure 8: YouTube & GCP’s combined contribution to Alphabet’s group revenues
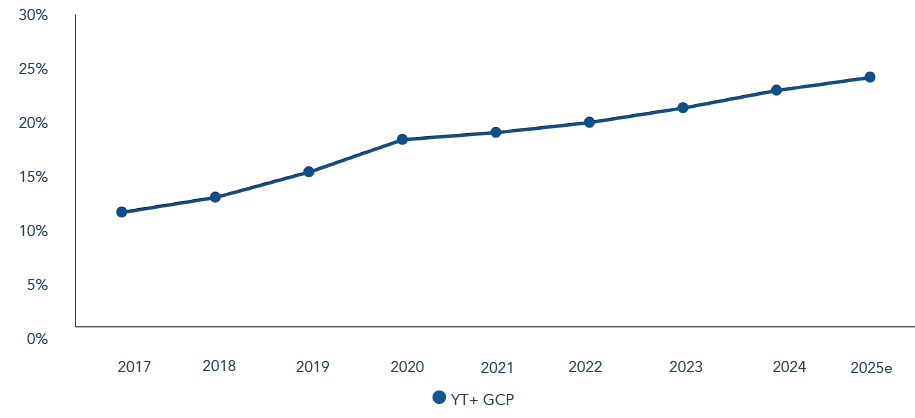
Source: Bloomberg, 30 June 2025. Past performance is not a guide to future performance. All references to benchmarks are for comparative purposes only.
Alphabet’s investments in AI drive other parts of the company in highly promising areas that are yet to contribute meaningfully to revenues. Of these ‘Other Bets’ the most visible and exciting is in robotics and specifically autonomous vehicles. Waymo is expanding fast since its commercial launch last year, reaching over 250,000 journeys per week in all four of its established US cities, and taking ~25% market share of ride hailing in San Francisco. Behind Waymo there are further astonishing advances in the life sciences and quantum computing. All are testament to Alphabet’s deep and continuous investments into new technologies.
In this context it makes little sense to us that Alphabet should be available to own at less than the US market’s own multiple of earnings. Whilst we readily acknowledge the risks and capital costs of LLMs, Alphabet’s shares are priced as if disruption of Search is a foregone conclusion. We believe that there is reason to believe that AI can be a tailwind for Search and not simply a disruptive force. The company’s current valuation gives the company little credit for its leadership in AI, Alphabet’s accelerated speed of innovation, and the many hard-to-replicate assets that it continues to develop. This creates a good chance that Alphabet’s shares can continue to generate value for its owners, and for this reason the company is the Strategy’s largest single investment. We were pleased to have the opportunity to add to the Strategy’s investment in Alphabet during April’s sell-off.
Amadeus IT: Beyond the mainstream
Our enthusiasm for Alphabet is only one part of why we think we can generate value owning what appear to be popular stocks. The other part of the answer is to emphasise that our investment process is also applied elsewhere, often far away from the biggest companies in the world. Amadeus IT is a Spanish company that has become a top 10 holding for the Strategy since it was first purchased last year. The company may not be a household name, but as the preeminent provider of ticket distribution and IT software to the airline industry, its services are essential for its airline customers and their passengers. Amadeus also has a growing presence running software for hotel chains.
We turn the same investment lens and process on Amadeus as we do for Alphabet, and we appreciate them for similar reasons. Like Alphabet, Amadeus is:
- Highly financially productive: The company is very profitable and cash generative with operating margins in the mid-20s and ~20% free cash flow margins. It is also capital efficient with mid-teens return on invested capital generated with limited use of debt.
- Increasingly diversified: Amadeus is broadly diversified by geography, customer, and product, and this diversification is increasing the company’s resilience and opportunities for future growth. Its faster-growing IT software business has expansive opportunities to take an increasing share of its customers’ IT spend. Amadeus’s more recent entry into the hotel software and services market significantly increases the company’s addressable market.
- Innovative, with high levels of reinvestment: The company is built for the long term and has invested vastly more than peers into R&D to innovate and win itself market share. Through a combination of organic investment and acquisitions it has moved beyond its legacy Global Distribution System (‘GDS’) business for airfare distribution towards solving the complex software needs of airlines, airports and hotels.
- Misunderstood: We believe Amadeus’s GDS to be more relevant and resilient than is commonly perceived. Despite airlines’ best efforts, it is simply too expensive and cumbersome for them to bypass GDS entirely to market their tickets directly, either to consumers or travel agents. Amadeus manages a highly efficient two-sided network that connects airlines via travel agents to high-value international customers. It does so with a finely tuned and variable transactional model that incentivises the agent and charges the airline according to the value of the booking. Contrary to popular belief, we see the advantages of Amadeus’s leading market share as reinforced rather than undermined as the industry moves to a new set of merchandising standards. Furthermore, the intense focus on the future of GDS distracts investors from Amadeus’s higher growth, higher quality IT software business, which already accounts for ~60% of group profits.
- Reasonably valued: The company is valued in-line with the rest of the Strategy at ~21x forward earnings and a ~4.5% free cash flow yield. This is inexpensive when compared to Amadeus’s own history, vertical software peers, and the company’s potential to grow annual earnings and cashflow per share sustainably in the low double-digits.
Confidence amid the chaos
We profile Alphabet and Amadeus to highlight the value we see embedded in the Strategy. One company is better known to the wider world than the other, but opportunity in both exists because the companies attract some controversy. We judge the debates that surround them according to our own internal research, taking a longer-term view than most investors, and weighing certain aspects heavier than others. In Alphabet and Amadeus, we find two proven leaders in growing industries that are investing aggressively and intelligently for the long term. They have the track-record, assets and know-how to navigate change and turn it to their advantage. Their valuations do not adequately reflect their great quality and improving diversification, nor their ability to compound earnings and cashflow at attractive rates of growth. The highly active and concentrated ownership of a portfolio of this kind of company gives us confidence at a time of significant political, economic and technological change. We think the Strategy is well placed to add value for its investors.
Thank you for your continued interest in the Strategy.
1 In USD. Source: FactSet, 30 June 2025.
2 In case you think we are being wise after the fact, we wrote about the risk when the fears peaked in October 2021, see here. There’s also a good case to be made that the incursions of Apple and TikTok in 2022 also eventually made Meta stronger than it otherwise would have been.
3 There is, of course, also the regulatory overhang, which we have explored elsewhere. See here.
4 Source: Bloomberg
5 Excluding autos, auto parts, and fuel.
7 The Harvard Business Review lists ‘therapy/companionship’, ‘organising my life’, and ‘finding purpose’ as the top three uses of LLMs. None are traditional uses of Google Search. https://hbr.org/2025/04/how-people-are-really-using-gen-ai-in-2025
8 Eric Seufert, Mobile Dev Memo
9 The contribution is higher if YouTube subscriptions is included, but subscription sales are not regularly disclosed by the company. In Q3 2024 they were worth ~$15bn in annual revenues, which would take YouTube and GCP’s combined revenues to ~30% of the group’s total.
Disclaimer:
The information shown relates to a mandate which is representative of, and has been managed in accordance with, Troy Asset Management Limited’s Global Equity Strategy. This information is not intended as an invitation or an inducement to invest in the shares of the relevant fund.
Performance data provided is either calculated as net or gross of fees as specified in the relevant slide. Fees will have the effect of reducing performance. Past performance is not a guide to future performance. All references to benchmarks are for comparative purposes only. Overseas investments may be affected by movements in currency exchange rates. The value of an investment and any income from it may fall as well as rise and investors may get back less than they invested. Neither the views nor the information contained within this document constitute investment advice or an offer to invest or to provide discretionary investment management services and should not be used as the basis of any investment decision. There is no guarantee that the strategy will achieve its objective. The investment policy and process may not be suitable for all investors. If you are in any doubt about whether investment policy and process is suitable for you, please contact a professional adviser. References to specific securities are included for the purposes of illustration only and should not be construed as a recommendation to buy or sell these securities. This is a marketing communication document.
Although Troy Asset Management Limited considers the information included in this document to be reliable, no warranty is given as to its accuracy or completeness. The opinions expressed are expressed at the date of this document and, whilst the opinions stated are honestly held, they are not guarantees and should not be relied upon and may be subject to change without notice. Third party data is provided without warranty or liability and may belong to a third party.
Although Troy’s information providers, including without limitation, MSCI ESG Research LLC and its affiliates (the “ESG Parties”), obtain information from sources they consider reliable, none of the ESG Parties warrants or guarantees the originality, accuracy and/or completeness of any data herein. None of the ESG Parties makes any express or implied warranties of any kind, and the ESG Parties hereby expressly disclaim all warranties of merchantability and fitness for a particular purpose, with respect to any data herein. None of the ESG Parties shall have any liability for any errors or omissions in connection with any data herein. Further, without limiting any of the foregoing, in no event shall any of the ESG Parties have any liability for any direct, indirect, special, punitive, consequential or any other damages (including lost profits) even if notified of the possibility of such damages.
Issued by Troy Asset Management Limited, 33 Davies Street, London W1K 4BP (registered in England & Wales No. 3930846). Registered office: 33 Davies Street, London W1K 4BP. Authorised and regulated by the Financial Conduct Authority (FRN: 195764) and registered with the U.S. Securities and Exchange Commission (“SEC”) as an Investment Adviser (CRD: 319174). Registration with the SEC does not imply a certain level of skill or training. Any product described in this document is neither available nor offered in the USA or to U.S. Persons.
© Troy Asset Management Limited 2025.